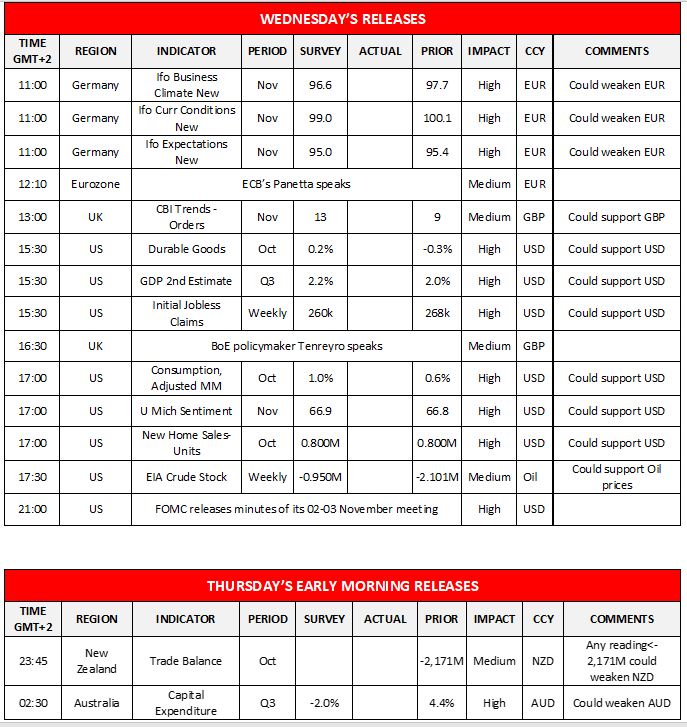
The USD seemed to stabilise against a number of its counterparts yesterday albeit there are still some bullish tendencies present, as the market today is about to get the minutes of FOMC November meeting. The Fed’s intentions are still a hot topic for the market and we expect the document to be closely scrutinised by investors and analysts. Fed officials in recent statements seemed to lean towards the hawkish side last week and market expectations seemed to rise. Should the document verify a more hawkish approach by a number of policymakers, we may see the USD gaining and vice versa. At the same time we would also note the slew of data we get from the US today as the durable goods rate for October, the weekly initial jobless claims figure, the consumption rate for October, the final University of Michigan consumer confidence for November, and October’s number of new home sales are due out, yet the high impact release of the day could be the 2nd estimate of the US GDP rate for Q3. All of the above combined into one trading day could create substantial volatility for the USD as well as US stock markets and Gold. It should be noted that gold’s prices were also under pressure due to the rising US yields. The same also seemed to apply on the tech sensitive Nasdaq, thus the movement of the US yields should also be kept under watch today.
XAU/USD dropped yesterday testing the 1786 (S1) support line before correcting a bit higher. We tend to maintain our bearish sentiment for the precious metal given also that the RSI indicator below our 4-hour chart is below the reading of 30, confirming the bearish sentiment of the market for Gold, yet may also imply that the precious metal is at oversold levels and the correction higher could be extended. Should the selling interest be renewed for the precious metal, we may see it breaking the 1786 (S1) support line and aim for the 1768 (S2) level. Should the correction higher be extended and buyers gain traction, we may see gold’s price reaching if not breaking the 1808 (R1) resistance line in search of higher grounds.
Oil rises as US prepares for reserve release
Oil prices tended to rise yesterday as the US announced its intentions to tap its emergency reserves in order to tackle rising oil prices. It should be noted that the move was made in a period that the average US consumer pays multi-year high prices according to media. At the same time India also announced its intentions to release a part of its reserves at a number of 5 million barrels. Overall, these moves are aimed at countering the tight supply for the commodity by petroleum producing countries cartel OPEC, which includes Saudi Arabia and Russia. The move by the US though may prove not to be a game changer for the international oil market according to analysts as OPEC may slow its production rate even further, which may have instigated the rise of oil prices yesterday. At the same time, we note the release of the weekly EIA crude oil inventories figure in the American session later today for oil traders and should another substantial drawdown be reported we may see oil prices gaining further.
WTI prices rose yesterday breaking the 76.60 (S1) resistance line, now turned to support. In their upward movement WTI’s prices also broke the downward trendline guiding it since the 10th of November hence we switch our bearish outlook in favor of a bias movement currently. Should the bears regain the momentum we may see the commodity’s price dropping breaking the 76.60 (S1) support line and aim for the 73.45 (S2) level. Should the bulls take over and extend yesterday’s rise, we may see the commodity’s price breaking the 79.00 (R1) resistance line and aim for the 82.00 (R2) level.
Other market highlights for today
Besides the US releases mentioned earlier we also note Germany’s Ifo indicators and UK’s CBI industrial trends both for November. In tomorrow’s Asian session we get New Zealand’s Trade data for October and Australia’s Capital Expenditure for Q3.
XAU/USD H4 Chart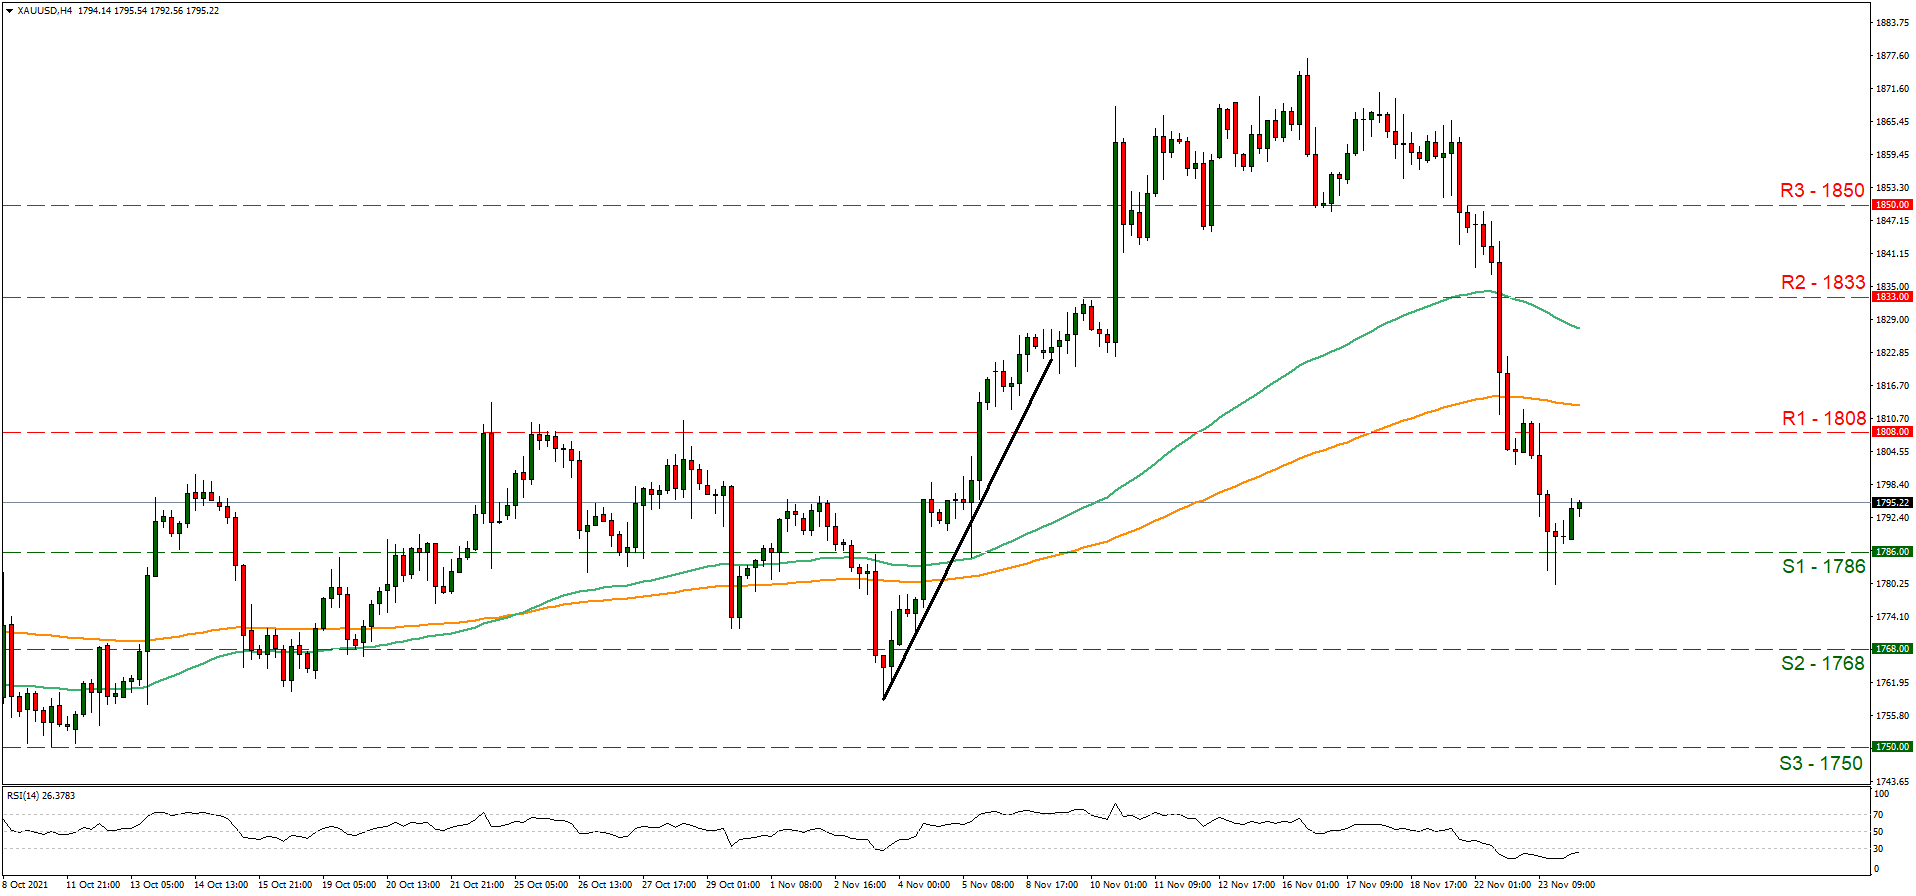
Support: 1786 (S1), 1768 (S2), 1750 (S3)
Resistance: 1808 (R1), 1833 (R2), 1850 (R3)
WTI H4 Chart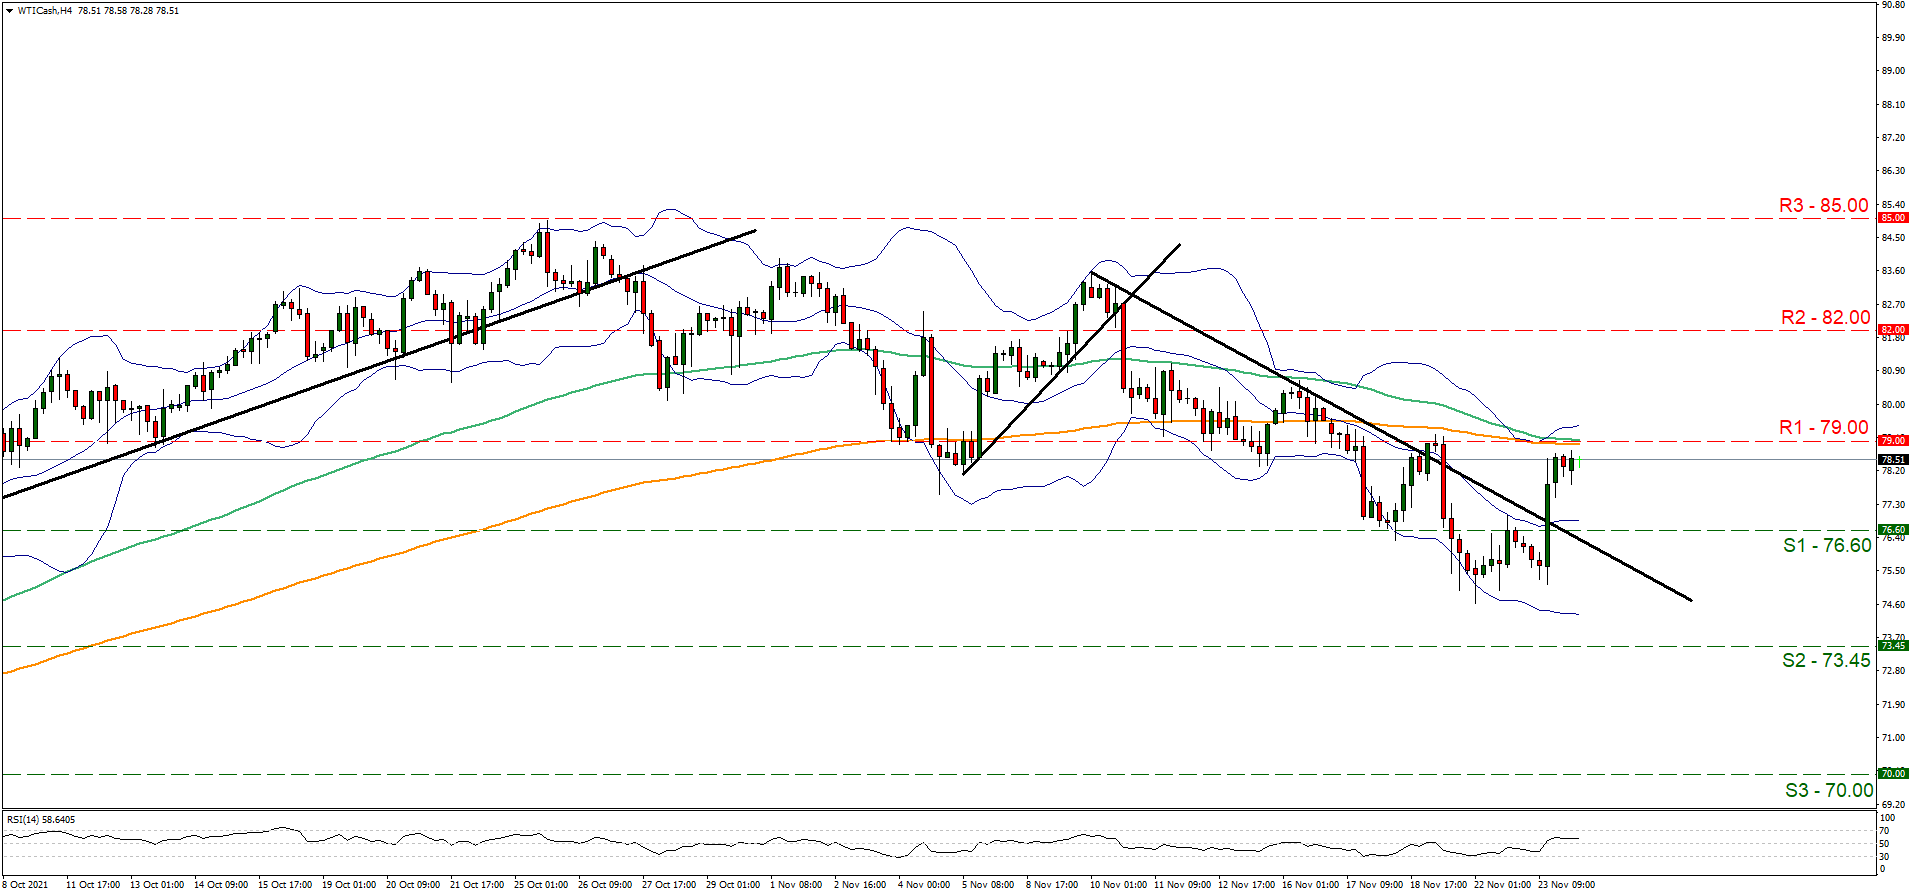
Support: 76.60 (S1), 73.45 (S2), 70.00 (S3)
Resistance: 79.00 (R1), 82.00 (R2), 85.00 (R3)