US equities extended the Christmas holiday rally as interest in stocks rose. The Dow Jones added more than 160 points, while the S&P 500 soared to a record high of $4,800. The Nasdaq 100 index moved sideways. Carnival was the biggest gainer in the S&P 500 as its stock rose by more than 3%. Other travel-related stocks like United Airlines and Southwest Holdings also rallied. This is a sign that investors are optimistic that the Omicron variant will not deter people from travelling. The top laggards were companies like Pfizer, Micron, and DexCom.
The US dollar rose even after the relatively weak US housing data. The closely-watched S&P Case-Shiller National Home Price Index rose by about 19.1% in the year that ended in October. This was a decline from the previous month’s increase of 19.1%. The number, which measures the average home prices in major metro areas, has declined in the past three months. Still, home prices have jumped sharply this month as buyers took advantage of low interest rates and low inventories. The existing-home sale price rose to $353,900 in November as the proportion of first-time homebuyers declined to 26%.
The economic calendar will have few events, since most countries published their monthly data last week because of the Christmas holiday. The key data to watch today will be from the United States. The Energy Information Administration (EIA) will publish the latest oil inventory data. Analysts expect the data to show that the country’s inventories declined by another 3.23 million barrels last week. That will be a smaller decline than the previous month’s decline of more than 4.7 million barrels. The US will also publish the latest pending home sales and mortgage numbers.
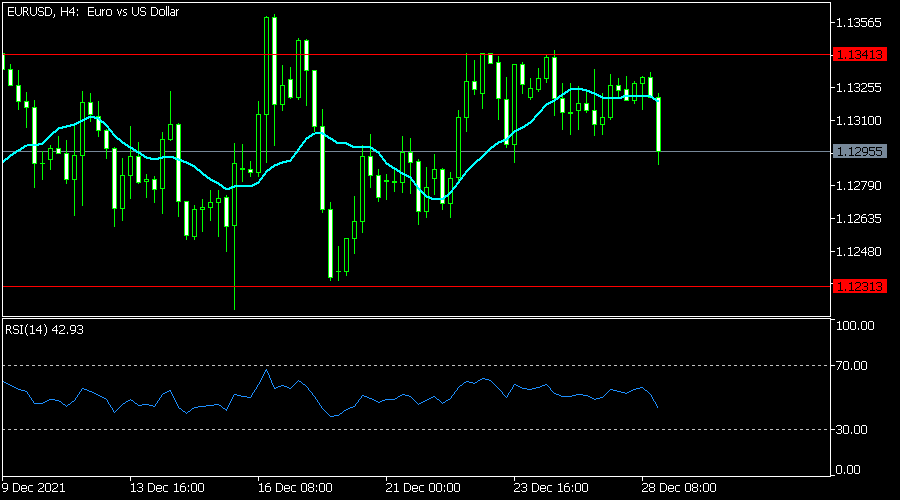
EURUSD
The EURUSD pair tilted lower after the relatively weaker US economic data. The pair declined to a low of 1.1293, which was the lowest level since December 23. The pair is slightly below the chin of the double-top pattern at 1.13000. It is still slightly below the upper side of the horizontal channel that is shown in red. Also, it has moved slightly below the 25-day and 50-day moving averages. Therefore, the pair will likely keep falling as bears target the lower side of the channel at 1.1230.
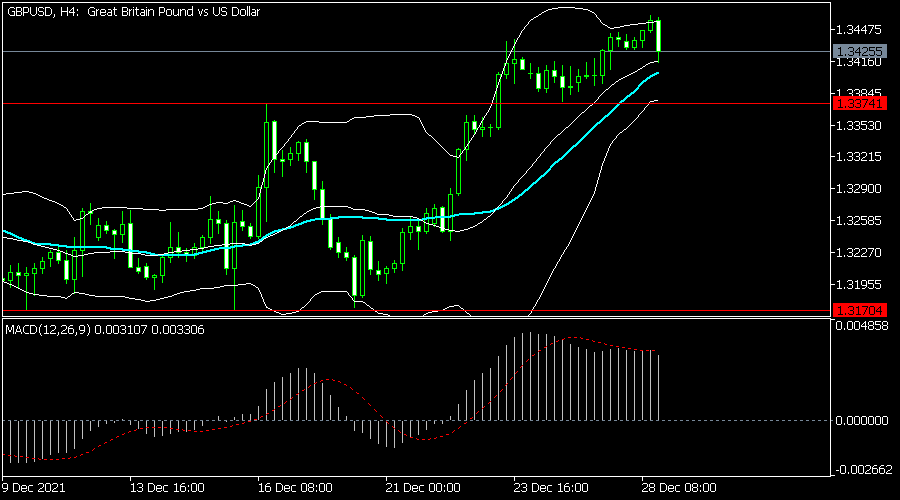
GBPUSD
The GBPUSD pair declined to 1.3415, which was slightly below this week’s high of 1.3462. The pair has formed what looks like a double-top pattern. It also moved to the middle line of the Bollinger Bands, while the Relative Strength Index (RSI) and MACD have moved lower. Therefore, the pair will likely keep falling as bears target the key support at 1.3375, which was at the highest level on December 16.
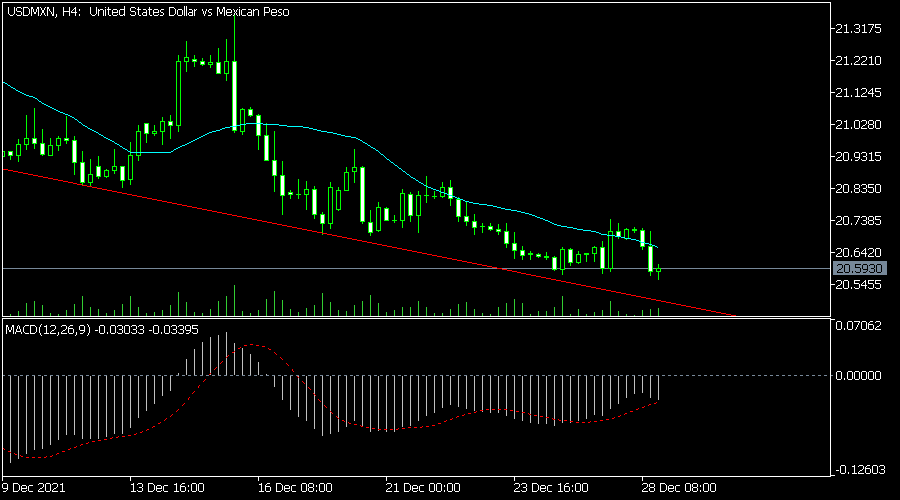
USDMXN
The USDMXN pair declined to the lowest level since November 15. It is trading at 20.58, which was substantially lower than November’s high of 22.15. It moved below the 25-day and 50-day moving averages. The pair is slightly above the descending trendline, which is the neckline of the head and shoulders pattern. The MACD has also been in a bearish trend. Therefore, the pair will likely keep falling as bears target the next support at 20.40.