
The Gold market presented significant strength moving upwards in the most recent daily sessions. Gold has moved in positive territory for the past 3 consecutive weekly sessions, while it is currently trading at a new 2022 high as a result of the recent bullish interest from traders. The global interest for the Gold market remains at extremely high levels especially at times such as the current, where geopolitical uncertainty seems to be the main focus. In this report we will be looking into the most important news moving Gold prices at the moment. We will finalize with our Gold technical analysis and provide a complete report for traders to work with.
In the past days and in the past week, Gold’s largest daily movement was carried out on the 17th of February. Gold strengthened in the European session on Thursday the 17th with no significant economic releases to validate the movement except the FOMC meeting minutes that took place the previous night. Through the report it was confirmed that inflationary pressures in the US have broadened in the second half of 2021 and may have now impacted sectors that were not affected by the pandemic in the first place. We must also highlight that US Inflation rates for January 2022 increased further possibly paving the road for the FOMC to start enacting interest rate hikes. Furthermore, analyst speculations on the path the central bank may select, can be strengthening or weakening the USD depending on how hawkish or bearish the sentiment is. At the moment, the FOMC seems to follow a more cautious or patient approach which may be restraining the US dollar but pushing Gold prices higher. In the past week, the USD Index gained marginally while Gold surged remarkably, implying the correlation between them remains weak yet positive. Understanding when Gold’s volatility increases can provide hints as to what may be motivating traders in the short term.
The main attraction for the Gold market and the global media scene at the moment, remains the developments on the Russia Ukraine subject. In the past week and specifically on the 18th of February the Donbass area in Ukraine announced evacuations, with people moving into Russian territory. Gold seems to be absorbing positive volatility from developments in Ukraine due to the fact that the tensions could be intensifying but also because it can lead to further economic risk. Europe’s trade relations to Russia in terms of energy sources can be tarnished while the subject could add up to already worrying inflationary pressures. As noted in our previous week’s report, in the scenario of escalation of tensions we may see Gold prices picking up while in a de-escalation scenario Gold prices may return lower.
As a final note, the upcoming economic releases from the US in the days to come, have the potential of moving Gold prices and caution is advised if traders are to place orders prior, during or after the releases. On Wednesday the 24th of February we get the GDP 2nd Estimate rate for Q4, the weekly Initial Jobless Claims figure and the New Home Sales-Units for January. On Thursday the 25th we get the Consumption Adjusted and Durable Goods rates for January while the Final University of Michigan Economic sentiment figure for February will also be released. On Tuesday the 1st of March we get the important ISM Manufacturing PMI figure for February.
Technical Analysis
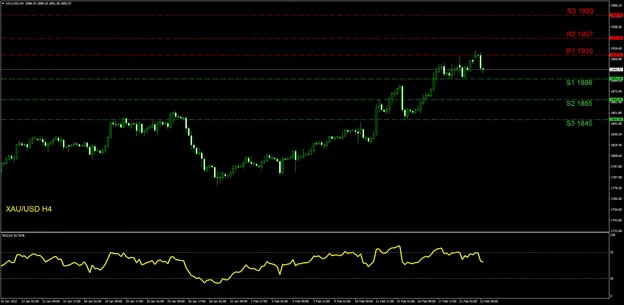
XAU/USD H4
The price action has recently reached and tested the (R1) 1910 resistance level but returned to lower grounds eventually. Note the (R1) 1910 is the highest level Gold has reached since June 2021. If this level is surpassed upwards then the (R2) 1927 line is in our view the most probable stop for traders. However, as our fundamental subjects seem to remain intact we have added also the (R3) 1950 level which can become a target in a strong bullish interest scenario. In case the precious metal is undertaken by a selling interest, the (S1) 1886 level can be reached first while the (S2) 1865 level is our next level, if the selling is to continue. Our final support level stands at the (S3) 1845 hurdle which can be reached in an extensive bearish trend line. Please note the RSI indicator has dropped below 70 implying some selling has taken place in the most recent hours. Overall Gold has breached new yearly high levels consistently thus we tend to support an upward bias, as our personal view.


