
EUR/USD: The Dollar Is Gaining Strength Again
The EUR/USD pair moved in a sideways channel of 1.0500-1.0600 for a week and a half. However, it is clear that neither investors nor speculators are interested in such stagnation. But some kind of trigger is needed to break out of it.
The last meeting of the G7 leaders and the NATO summit did not have any particularly loud statements. At both events, a desire was expressed to continue helping Ukraine in its military confrontation with Russia, and the NATO bloc was replenished with two new members, Sweden and Finland. But these results were not enough to somehow influence the quotes of the dollar and the euro.
The trigger for the strengthening of the dollar, which forced the EUR/USD pair to go south on Tuesday, June 28 and break through the lower limit of the channel the next day, was the growth in demand for protective assets amid concerns about the prospects for the world economy. And taking into account the fact that the American currency has recently acted as a protective asset, the scales have tilted in its direction.
Speaking at the annual forum of the European Central Bank in Sintra, Portugal, ECB President Christine Lagarde said that “inflation expectations in the Eurozone are much higher than before”, that “we are unlikely to return to conditions of low inflation soon”, and that the regulator “will go as far as necessary to reduce inflation to the target of 2%”. Christine Lagarde confirmed that the ECB intends to raise its key interest rate by 0.25% at its meeting on July 21 in order to achieve this goal. However, according to market participants, such a modest step is unlikely to have any serious effect. And the next meeting of the Bank will take place only in autumn, on September 08. So, most likely, inflation will continue to grow during this period.
The speech of US Federal Reserve Chairman Jerome Powell, who participated in the ECB forum as a colleague and guest of honor, was quite different in tone from the words of Christine Lagarde. The American assured the audience that the US economy is in a good position to cope with the active tightening of monetary policy, which is being implemented by his department.
The divergence between the ECB’s careful monetary policy and the hawkish Fed has always been interpreted by the market in favor of the dollar. The same happened this time as well, and the EUR/USD pair continued its fall.
The European currency was slightly helped by weak macro data from the US in the second half of June 30. The impetus for a temporary rise in the pair was the release of data on GDP, which turned out to be less than expected, falling by 1.6% instead of the expected 1.5%. In addition, statistics showed a slowdown in economic growth rates from 5.5% to 3.5%. Data on basic spending on personal consumption in the United States did not live up to expectations either. Data on applications for unemployment benefits in the United States turned out to be noticeably worse than expected. Thus, the number of initial requests should have been reduced from 233K to 218K. However, their number decreased to only 231 thousand. The situation is similar with repeated requests, which decreased from 1.331K to just 1.328K.
However, all of the above negative factors provided only temporary support to the European currency. Fixing quarterly profit on the dollar did not help it much, and it went on the offensive again on Friday. The publication of data on inflation in the Eurozone, which accelerated from 8.1% to 8.6%, only speeded up the flight of investors to safe assets. As a result, the pair fixed a local bottom at 1.0364 and ended the five-day period at 1.0425.
The votes of experts at the time of writing the review, on the evening of July 01, are divided as follows: 35% side with the bulls, 50% – with the bears, and 15% are neutral. Among the oscillators on D1, 75% are red, 10% are green, and 15% are neutral gray. Trend indicators have 100% on the red side. The nearest resistance is located in the zone 1.0470-1.0500, then the zone 1.0600-1.0615 follows, in case of success the bulls will try to rise to the zone 1.0750-1.0770, the next target is 1.0800. Except for 1.0400, the bears’ task number 1 is to break through the support zone 1.0350-1.0364, formed by the lows of May 13 and July 01. If successful, they will move on to storm the 2017 low of 1.0340, below is only 20-year-old support and the cherished goal, 1:1 parity.
This coming week, July 04 is a public holiday in the USA: the country celebrates Independence Day. Statistics on retail sales in the Eurozone will be released on Wednesday, July 06. The publication on the same day of the ISM index of business activity in the US services sector and the minutes of the June meeting of the FOMC (Federal Open Market Committee) are also noteworthy. A similar minute of the ECB meeting and the ADP report on the level of employment in the US private and non-farm sectors and the number of initial applications for unemployment benefits will be published on Thursday, July 07. And another portion of data from the US labor market will arrive on Friday, October 08, including such important indicators as the unemployment rate and the number of new jobs created outside the agricultural sector (NFP).
GBP/USD: Similarities and Differences with EUR/USD
GBP /USD showed similar dynamics to EUR/USD last week. The reasons for the ups and downs of quotes are also similar. Therefore, it makes no sense to list them again. The pair moved clamped in the side channel 1.2165-1.2325 for a week and a half, and then flew down on June 28. A breakdown of support at 1.2100 increased bearish pressure, and it recorded a two-week low at 1.1975. This was followed by a correction to the north, and the pair finished at 1.2095;
Despite the fact that the euro and the pound behaved similarly against the dollar, there are still differences between them. The position of the Eurozone economy is complicated by a heavy dependence on Russian natural energy, the supply of which is limited due to sanctions imposed on Russia after its invasion of Ukraine. The situation is gradually improving: it became known that the United States bypassed Russia in gas supplies to Europe in June, for the first time. However, the final solution of the energy problem is still far away.
Unlike the EU, the UK’s dependence on Russian energy is minimal. However, the strengthening of the British currency is hampered by political instability. Prime Minister Boris Johnson already survived a vote of no confidence in June, with several lawmakers from his own Conservative Party voting against him. In addition, after the by-elections, the party lost two seats in the UK Parliament. Problems associated with Brexit also add nervousness. The British pound came under additional pressure after MPs approved a bill allowing ministers to cancel part of the Northern Ireland protocol.
As for the country’s economy, according to some experts, inflation in the United Kingdom will continue to grow and may exceed 11% by November.
At the moment, 60% of experts believe that the pair GBP/USD will try to consistently test the support of 1.1975 and 1.1932 in the near future. 40%, on the contrary, are waiting for a breakdown of the resistance at 1.2100 and further to the north. Among the trend indicators on D1, the power ratio is 100:0% in favor of the reds. Among the oscillators, the advantage of the bears is slightly less: 75% indicate a fall, the remaining 25% have turned their eyes to the east. Strong support lies at 1.2000, followed by lows of July 01 at 1.1975 and of June 14 at 1.1932. The bears’ medium-term target may be the March 2020 low of 1.1409. In case of growth, the pair will meet resistance in the zones and at the levels of 1.2100, 1.2160-1.2175, 1.2200-1.2235, 1.2300-1.2325, 1.2400-1.2430, 1.2460, then the targets in the area of 1.2500 and 1.2600 follow.
As for the macroeconomic calendar for the UK, we advise you to pay attention to Tuesday, July 05, when the speech of the head of the Bank of England Andrew Bailey is expected. The composite PMI index and the index of business activity in the UK services sector will be published on the same day, and the index of business activity in the construction sector of this country a day later.
USD/JPY: Just a Breather or a Change in Trend?
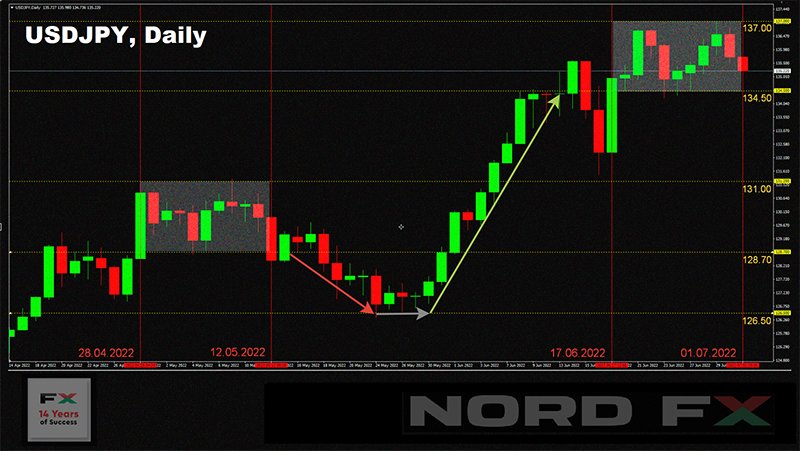
USD/JPY hit a new 24-year high last week once again, climbing to a high of 136.99 on Wednesday June 29. However, the difference from the previous high of June 22 is less than 30 points, and the two-week chart already looks more like a sideways channel than an uptrend. Perhaps the strength of the bulls has dried up and they, at least, need a break.
And perhaps, finally, the long-awaited dream of Japanese importers and housewives will come true, and the yen will go on the offensive, regaining the status of a popular safe-haven currency? It’s possible. But not guaranteed. The difference between the super-dove monetary policy of the Central Bank of Japan and the distinctly hawkish monetary policy of the US Central Bank is too great.
Most analysts (50%) still expect the pair to move down at least to the 129.50-131.00 zone. 30% of experts vote for the fact that the pair will once again try to renew the maximum and rise above 137.00, and 20% believe that the pair will take a breather, moving in the side channel 134.50-137.00. For indicators on D1, the picture is very different from the opinion of experts. For oscillators, 65% are colored green (of which 10% are in the overbought zone), the remaining 35% have taken a neutral position. For trend indicators, 65% point north as well, and only 35% point south. The nearest support is located at 134.50-134.75, followed by zones and levels at 134.00, 133.50, 133.00, 132.30, 131.50, 129.70-130.30, 128.60 and 128.00. Apart from overcoming the immediate resistance at 136.00-136.35 and taking the height of 137.00, it is difficult to determine further targets for the bulls. Most often, such round levels as 137.00, 140.00 and 150.00 appear in the forecasts. And if the pair’s growth rates remain the same as in the last 3 months, it will be able to reach the 150.00 zone in late August or early September.
No important events, be it the release of macroeconomic statistics or political factors, are expected in Japan this week.
CRYPTOCURRENCIES: Will Bitcoin Drop to $1,100? We look at the US Federal Reserve.
The battle for $20,000 continued throughout the second half of June. The BTC/USD pair fell to $17,940, then rose to $21,940. It should be noted that $20,000 is historically the most important level for the main cryptocurrency. Suffice it to recall the catastrophic crash of December 2017, when bitcoin approached this mark, reaching a height of $19,270, and then collapsed by 84%. Many experts expect something similar now, predicting a further fall of another 50-80% for the BTC/USD pair. And Robert Kiyosaki, author of the bestselling book Rich Dad Poor Dad, predicts an even more powerful collapse of bitcoin, by 95%, to $1,100.
In the meantime (Friday evening, July 01), the coin is trading in the $19,440 zone. The total capitalization of the crypto market at this moment is $0.876 trillion ($0.960 trillion a week ago). The Crypto Fear & Greed Index, like a week ago, is in the Extreme Fear zone at around 11 points out of 100 possible.
If you look at the charts, you can see that the bears had a clear advantage over the past week. And, in fairness, we note that bitcoin itself is not really to blame for this. It’s all about the strengthening of the dollar, which is growing due to the rise in rates and the tightening of the monetary policy of the US Central Bank. In such a situation, investors prefer to get rid of risky assets by purchasing US currency. Global stock markets are under pressure from sellers, the MSCI World and MSCI EM indices are going down, showing the situation in developed and emerging markets, respectively. Among the developed markets, the main pressure fell on the European sites, but did not bypass he US either: the S&P500, Dow Jones and Nasdaq Composite, with which BTC is in direct correlation, are also moving south.
Additional downward pressure on the quotes of the first cryptocurrency is exerted by mining companies in need of liquidity. According to JPMorgan bank strategist Nikolaos Panigirtzoglou, this situation will continue in Q3 of 2022. According to the expert’s calculations, public mining companies account for about 20% of the hash rate. Many of them sold bitcoins to cover operating expenses and service loans. Due to the more limited access to capital, private miners took similar steps as well. “Unloading will continue in Q3, if the profitability of production does not improve. This was already evident in May and June. There is a risk that the process will continue,” the JPMorgan strategist believes.
According to Bloomberg, the cost of mining 1 BTC from $18,000-$20,000 at the beginning of the year dropped to about $15,000 in June due to the introduction of more energy-efficient equipment. However, it is not yet clear whether this will be enough for the stable functioning of the miners.
The recession in the cryptocurrency market will last for about 18 more months, and the industry will see the first signs of recovery after the easing of the Fed’s monetary policy. This was stated by the head and founder of the Galaxy Digital crypto bank Mike Novogratz in an interview with New York Magazine. “I hope we have already seen the worst. I would be more confident about this if I knew what inflation would be like in the next two quarters. […] I think the Fed will have to abandon the rate hike by the fall, and I believe that will make people calm down and start building again,” said the head of Galaxy Digital.
According to Novogratz, the crisis has changed people’s attitudes towards high-risk assets like cryptocurrencies. He noted that the past few months have shown the industry’s dependence on leverage, which no one knew about. And it will take time now for the bankruptcy of weak players and the sale of collapsed assets. According to the head of Galaxy Digital, the situation is similar to the global financial crisis of 2008, followed by a wave of consolidation in the investment and banking industries.
Crypto analyst Benjamin Cowen doubts that the forecasts for a high BTC rate for 2023 can come true. In particular, he spoke about the forecast of venture capital investor Tim Draper, according to which the price of bitcoin could grow by more than 1000% from current levels and reach $250,000.
“I used to believe that BTC would be above $100,000 by 2023, but now I am skeptical about this idea. Especially after the Fed’s policy has changed so much over the past six months,” Cowen wrote. “I also look at other things, like social media statistics, and I see that the number of people interested in cryptocurrencies is in a downtrend. If it is difficult for people to buy gasoline, it will be even more difficult to buy bitcoin.”
Instead of a huge rally, Cowen predicts an uninteresting BTC market over the next two years: “I think the bear market will end this year, and then the accumulation phase will begin, as in 2015 and 2019. Then there will be slow preparations for the next bitcoin halving, and the Fed may lower interest rates due to the victory over inflation during this period.”
It is clear that many forecasts depend on the models, indicators and other analysis tools used. For example, we wrote a week ago how the creator of The Daily Gwei, Anthony Sassano, and the co-founder of Ethereum, Vitalik Buterin, criticized the Stock-to-Flow (S2F) model, on the basis of which a popular analyst aka PlanB issued his forecasts. Following criticism, PlanB has unveiled a chart of not one, but five different forecasting models. Indeed, S2F showed an overly optimistic view. The most accurate picture was given by estimates based on the complexity and costs of mining the first cryptocurrency.
Another analyst named Dave the Wave uses a logarithmic growth curve (LGC) model and believes that BTC can grow by 1100% within 4 years and reach $260,000. In the short term, Dave the Wave predicts the possibility of bitcoin rising to $25,000.
According to the cryptanalytic platform CryptoQuant, most cyclical indicators (Bitcoin Puell Multiple, MVRV, SOPR and the MPI BTC Miner Position Index) indicate that bitcoin is close to the bottom. The readings of these indicators are based on a historical pattern that has preceded an uptrend several times. Indicators also suggest that bitcoin is currently undervalued, signaling an imminent rally. A significant amount of unrealized losses confirms this forecast.
Anthony Scaramucci, the founder of SkyBridge Capital investment fund, also said that the first cryptocurrency is “technically oversold”. He made this conclusion by analyzing the current BTC price in the context of an exponential growth in wallet activity and an increase in the number of use cases. At the same time, the hedge fund manager advised investors to evaluate bitcoin in retrospect. With this approach, the asset will turn out to be “very cheap due to excess leverage, which is worth taking advantage of.”
We talked at the end of the previous review about another “forecasting model” presented by the President of El Salvador, Nayib Bukele. “My advice is to stop looking at charts and enjoy your life. If you have invested in BTC, your investment is safe, its value will rise immeasurably after the end of the bear market. The main thing is patience,” the head of state wrote.
And now Yifan He, CEO of Chinese blockchain company Red Date Technology, has responded to this advice. He compared cryptocurrencies to financial pyramids and stated that the authorities of El Salvador and the Central African Republic (CAR), who decided to legalize bitcoin, are in serious need of basic education in finance. According to He, the leaders of these states put entire countries at risk, unless their original intention was to fraud their own citizens. It is not yet known whether Naib Bukele was offended by such words. We will follow the news.


