
U.S. Highlights
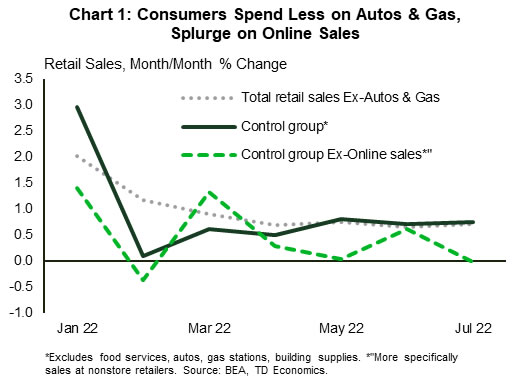
- Total retail sales were flat in July, marking a deceleration from June’s pace. However, sales in the control group, which exclude several volatile categories and are used in calculating GDP, rose a sturdy 0.8% m/m.
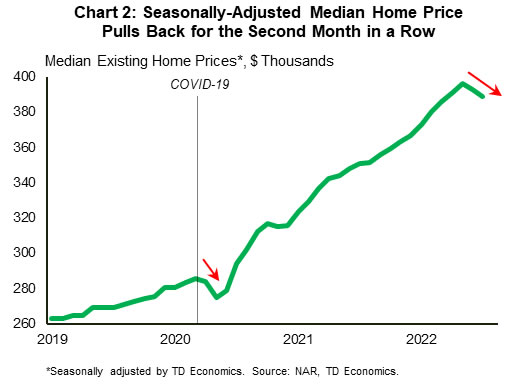
- Housing continued to cool in July. Existing home sales fell 5.9% and the median seasonally adjusted home price retreated for the second month in a row. Homebuilders also continued to ease off the accelerator, with starts down 9.6% in July.
- Minutes from last month’s FOMC meeting revealed that many participants acknowledged the risks that that the Committee could tighten the stance of policy by “more than necessary”.
Canadian Highlights
- Headline inflation cooled a bit to 7.6% y/y in July on lower fuel prices. However, inflation remains uncomfortably high, and is not hitting all households equally.
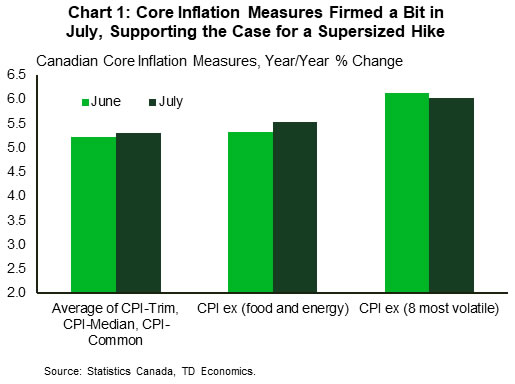
- Core inflation measures ticked higher last month, supporting the case for an aggressive September BoC hike.
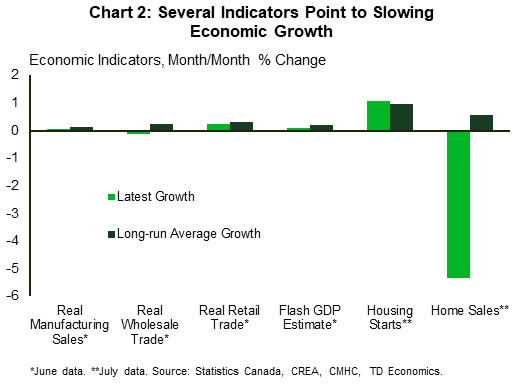
- Growth indicators released this week generally confirmed that economic growth is cooling. The BoC faces an increasingly tough task of engineering a soft-landing.
U.S. – How Quickly to Raise Rates? That Is the Question
The third week of August was a busy data week for the U.S., with updates on housing and the consumer for July. The consumer spent a little more than expected at retailers (omitting auto dealers and gas stations), thanks to a successful Amazon Prime Day event, but housing is continuing to recalibrate to the higher rate environment.
Headline retail sales were flat in July, marking a deceleration from June’s 0.8% month-over-month (m/m) gain. However, the headline measure was dragged down by sales auto & part dealers (-1.6%) and gasoline stations (-1.8%), the latter reflecting lower prices at the pump. Retail sales in all other categories rose a sturdy 0.7% m/m. Similarly, sales in the control group, which strip a couple of more categories from the total and are used in calculating personal consumption expenditures and GDP, were up 0.8% m/m thanks to a boost from sales at non-store retailers (Chart 1). Total CPI inflation was flat in July, so by these measures, real goods consumer spending appears to have had a decent start to the third quarter.
Consumers also spent handsomely at building material and supply dealers last month (+1.5% m/m), a move that went against the grain of the ongoing weakening in housing. Existing home sales fell by almost 6% in July, extending their downward slide from the start of the year to a staggering 26%. Home prices have also been feeling the impact of higher rates, with the median seasonally adjusted home price falling in each of the last two months (Chart 2). The fact that mortgage rates have eased a bit over the past several weeks could provide an opportunity for the housing rout to take a breather. However, the Fed is not done hiking rates, so affordability is likely to remain a meaningful constraint for the foreseeable future. As a result, we expect home sales to continue trending moderately lower through the first half of next year.
Homebuilders have continued to ease off the accelerator amidst this challenging market backdrop, with starts falling 9.6% in July. The weakness in homebuilding over the last several months has been concentrated in the single-family market. A recent sharp decline in homebuilder confidence in this sector suggests that the trend is poised to continue.
The fallout from the downturn in the housing market is only one factor the Fed must consider as it gears up to raise rates again next month. Minutes from last month’s FOMC meeting revealed that many members acknowledged the risks that the Committee could tighten the stance of policy by “more than necessary”. In addition, participants judged that as the policy rate is tightened further “it would become appropriate at some point to slow the pace of policy rate increases” to assess the impacts. Markets interpreted this as a signal that the pace of rate hikes would slow soon, but a few Fed officials (i.e., Bullard, voting member, backs a 75-basis point (bp) hike next) appeared to push back against that notion. For now, markets are pricing in a 50-bp hike at the next meeting. Chair Powell’s Jackson Hole speech next Friday will be closely watched to gauge the Fed’s latest thinking as to where rate hikes are headed.
Canada -Hot to the Core
Canadian financial markets had their eyes fixed squarely on this week’s inflation report – the last ahead of the Bank of Canada’s rate decision on September 7th. Bond markets reacted by taking short-term yields a bit higher on the week, as core inflation pressures intensified in July. We expect the Bank of Canada to hike their policy rate by 50 basis points (bps) at their September meeting, but the inflation data does tilt the risk to a 75 bp move.
Whether it’s 50 or 75 bps, the move likely won’t elicit the same sticker-shock as their surprise 100 bp hike in July. However, it would still represent an aggressive increase, and be consistent with messaging from Governor Macklem that it’s better to front-load tightening now, rather than having to be more aggressive later. It will also probably not be their last hike. As detailed in our latest quarterly outlook piece they’ve communicated a need to move rates above their estimate of the neutral range (i.e., above 3%) to maintain credibility.
Looking at the details of July’s CPI data, overall inflation cooled a bit to 7.6% year/year (y/y) on a big drop in fuel prices. However, the metric that policymakers tend to put more weight on is core inflation. Nearly all measures of core inflation perked up in July (Chart 1). Even the metrics that didn’t move higher, like CPI-trim, remained uncomfortably high, underscoring the case for an aggressive September salvo.
A 7.6% inflation rate is still much too elevated, and high inflation impacts everybody, albeit not to the same degree. Our research put out this week, notes that it’s likely middle-income households that have been hit the hardest by inflation, given their relatively high share of spending on food and transportation.
Ultimately inflation saps purchasing power and weighs on growth in real terms, and this week featured a series of releases offering clarity on how growth is faring. The main message from nearly all these indicators is that growth is slowing (Chart 2), consistent with the soft flash estimate for June’s monthly GDP growth. On top of this, TD’s high-frequency internal credit and debit card spending data is showing signs of easing as the summer rolls on.
The BoC did forecast slower growth in the third quarter in their July MPR, and some easing in economic activity is required to bring inflation down. Like the Fed, the BoC is trying to engineer a “soft-landing” scenario, where economic growth is below-trend for a time, but still positive, and inflation cools. That’s an incredibly tough balance to strike, and with the persistent heat in core inflation, the chances of this outcome unfolding are likely diminishing.


