U.S. Review
Hurricanes Harvey and Irma Blow Payrolls Off Course
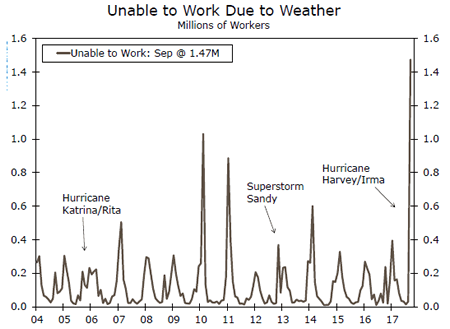
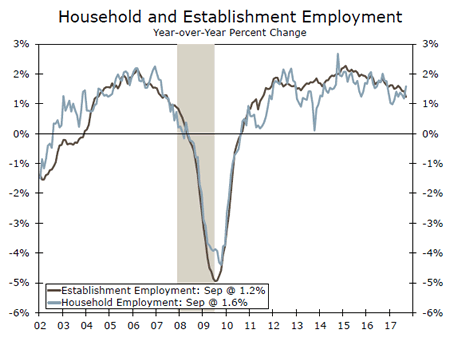
- Nonfarm payrolls contracted for the first time since 2010 as Hurricanes Harvey and Irma disrupted work and routine hiring. Even though a record number of people were unable to work due to the weather, the unemployment rate fell to 4.2 percent amid a curiously strong rise in the household measure of employment.
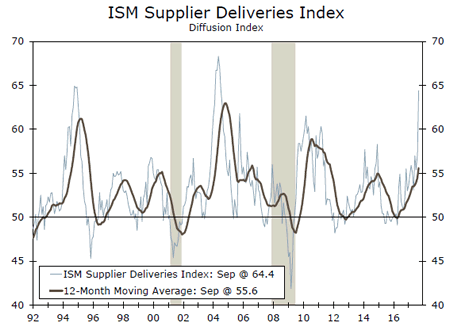
- The ISM manufacturing and nonmanufacturing indexes hit multi-year highs in September. While some of the strength can be traced to longer supplier delivery times from storm disruptions, production, new orders and employment improved in both surveys.
Hurricanes Harvey and Irma Blow Payrolls Off Course
Employment contracted for the first time in seven years last month as Hurricanes Harvey and Irma disrupted work and typical hiring. Nonfarm payrolls contracted by 33,000 jobs in September, led by a 111,000 decline in the leisure & hospitality sector. Average hourly earnings rose a stronger-than-expected 0.5 percent, but the average wage last month was flattened by the drop in the low-paying leisure & hospitality industry.
Roughly 1.5 million people reported that they were unable to work during the survey reference period, which was the week that Hurricane Irma hit Florida. Yet paradoxically, the number of people defined as employed last month jumped by 906,000. That was the biggest one-month increase since 2013 and more than four times the average over the past year. Even with an increase in labor force participation, that pushed the unemployment rate down to 4.2 percent.
The household survey can be even more volatile than the payroll survey given its small sample size (about 60,000 households) so monthly readings can exaggerate the trend. Given that September conditions were particularly atypical, we have a hard time taking the drop in the unemployment rate and rise in participation at face value this month.
The manufacturing sector looks to have been relatively unshaken by the recent storms. Factory orders for August rose 1.2 percent in August amid strong demand for durable goods. Nondefense capital goods order ex-aircraft are now up 7.2 percent on a three-month average annualized basis and point to solid equipment spending in the months ahead.
The timelier ISM manufacturing index suggests the positive momentum carried into September. At 60.8, the index rose to its highest level since 2004. Some of the headline’s gain was attributable to longer supplier delivery times—usually a sign of growing demand at suppliers, but in the most recent month lengthened by supply chain disruptions. Nevertheless, supplier delivery times have been lengthening since the start of the year and look to have encouraged more hiring. The employment index rose to a six-year high and is consistent with manufacturing payrolls having risen by an average of 9,700 since July.
Production looks set to remain strong with the new orders index coming in above 64. We suspect the auto sector is providing some temporary support as Harvey and Irma have generated the need to replace vehicles. Auto sales jumped to an annualized rate of 18.5 million units from a two-and-a-half year low in August.
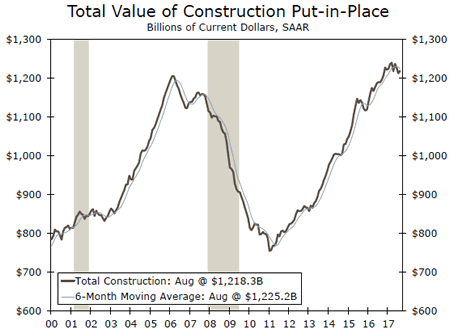
While the manufacturing sector has shifted into a higher gear this year, construction activity has slowed. The o.5 percent rise in August construction outlays came on the heels of a 1.2 percent pullback, which was twice as steep as what was initially reported. Elsewhere outside the manufacturing sector, however, activity continues to expand. The ISM non-manufacturing index leapt to a new cycle in September. The pickup was supported by rising current activity, new orders and employment, but also longer supplier delivery times.
U.S. Outlook
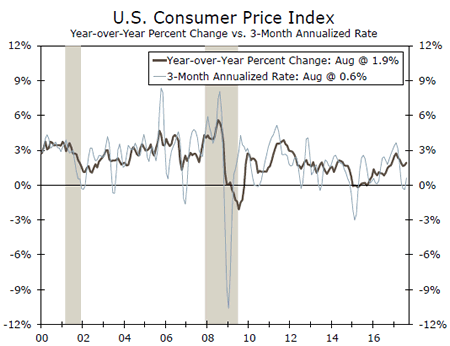
CPI • Friday
Markets and FOMC members will closely be watching the September CPI release next Friday. After three months of lowerthan- expected inflation readings, the CPI index came in higher than what markets forecasted in August. The September reading has significant monetary policy implications as the FOMC prepares to continue to raise rates. On a year-over-year basis, core inflation continues to look rather anemic. Ex-food and energy, prices were up 1.7 percent over the past 12 months. Following the August gain, however, the recent trend looks stronger; over the past three months, the core index has risen at a 1.9 percent annualized pace.
August’s strong gain should help alleviate concerns among Fed members that the slowdown in inflation that began in the spring is set to continue. A strong September print would further ease inflation worries and make a December rate hike more likely.
Previous: 0.4% Wells Fargo: 0.6% Consensus: 0.6% (Month-over-Month)
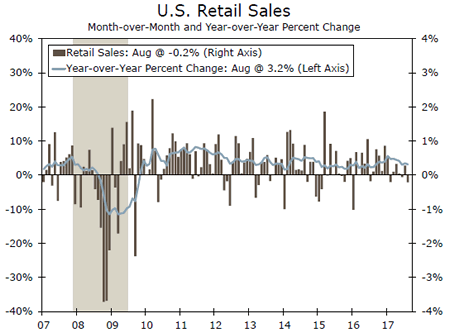
Retail Sales • Friday
We expect retail sales to grow 1.7 percent in September following a 0.2 percent contraction August, month over month. August’s contraction can largely be traced to Hurricane Harvey’s impact, with most store categories showing steep declines. Auto sales experienced the sharpest drop with sales of motor vehicles and parts declining 1.6 percent. The decline in auto sales eclipsed the boost from the 2.5 percent rise at gas stations.
For September, we expect building supply stores to have much stronger sales as Houston and the entire state of Florida rebuild and recover from major back-to-back storms. The data in September’s release are likely to contain Harvey-related noise, which will make gauging the actual strength of the consumer more difficult.
Previous: -0.2% Wells Fargo: 1.7% Consensus: 1.4% (Month-over-Month)
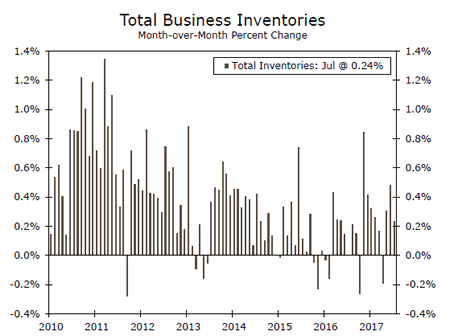
Business Inventories • Friday
Business inventories rose for a third consecutive month in July and look poised to add to third quarter GDP. Next Friday, August inventory data is slated to be released.
Although we only have one month of the quarter’s data in, we expect inventories will be additive to GDP in Q3. As we have highlighted before, it would not take much of an increase in real inventories to provide a significant boost to GDP following two quarters of scant stock building. We are currently penciling in a $40 billion annualized increase, which would add 0.8 percentage points to topline GDP growth. Given the late stage of the business cycle, it is not altogether shocking that we have witnessed more caution on the part of businesses recently. That caution is manifested in the seven times in the past nine quarters in which inventories have been a drag on growth. Friday’s release will be very telling for the direction inventories will push/pull GDP in Q3.
Previous: 0.2% Wells Fargo: 0.6% Consensus: 0.4% (Month-over-Month)
Global Review
Soft Consumer Numbers in Australia
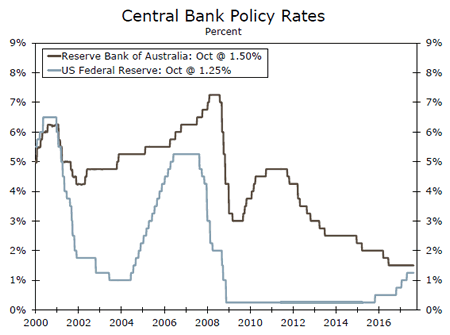
- Australia’s Reserve Bank (RBA) kept rates on hold this week. The latest data for retail sales substantiated the RBA’s recent warnings about the sustainability of consumer spending amidst elevated consumer debt. Not only did Australian retail sales fall in August, the initial flat reading for July was revised to show a decline.
- The latest survey data offer mixed signals for business activity in the United Kingdom.
- After a strong start to the year, a slowdown in the pace of hiring in Canada is consistent with our outlook for slower Canadian growth in the second half.
RBA’s Fears Come True With Consumer Spending Slip
The Reserve Bank of Australia (RBA) has kept its official cash rate at 1.5 percent for a little over a year now. The RBA is faced with balancing rising consumer debt amidst a run-up in home prices. Although there have been some signs of firming in the Aussie economy, a recent miss in consumer spending figures highlights the pressure on many Aussie households at present. We learned this week that Australian retail sales fell 0.6 percent in August which follows a smaller decline in the prior month. Although the RBA meeting occurred before the retail sales print hit the wire, policymakers at the Bank have been highlighting the unsustainability of household debt in recent communications. With inflation still low and wobbly fundamentals in housing, we still see the RBA on hold well into 2018. Going into the week, one could have reasonably expected the RBA to indicate a tightening bias. However after this week’s lousy retail sales figures, which included a downward revision to prior data, one board member mentioned to a U.S. media outlet late in the week that another rate cut cannot be ruled out.
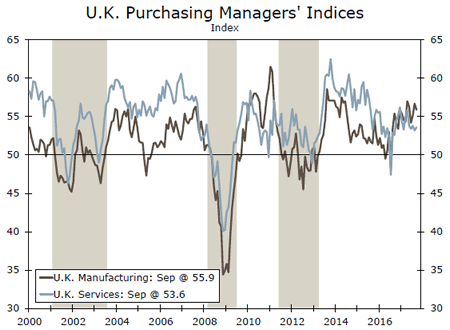
Business Activity in the United Kingdom
Speaking of central banks, the Bank of England is on hold as well and we expect it will refrain from raising rates until after the turn of the year. That accommodative monetary policy stance is helping to underpin economic activity in the United Kingdom, but some measures of business spending have softened. Until some of the uncertainty surrounding the Brexit process is cleared up, businesses may take a "wait-and-see" approach which could hinder investment spending.
Earlier this week, the manufacturing as well as the service sector PMIs for the United Kingdom were released. While both measures have bounced off their post-Brexit lows, there was a sharper recovery on the manufacturing side, perhaps reflecting the boost from the earlier decline in the value of the British pound. As the currency has retraced some of its lost value in recent months, the pace of expansion in the manufacturing sector has moderated. The U.K. manufacturing PMI slipped to 55.9 in September from 56.7 reading in the prior month. The U.K. services PMI rose slightly more than expected to 53.6.
Canadian Employment Friday
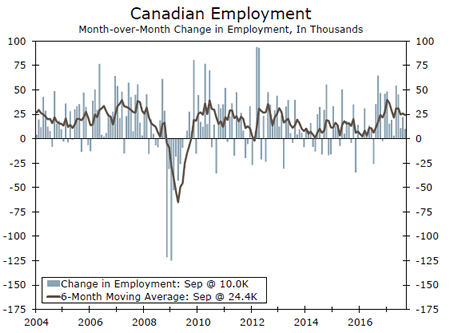
Thanksgiving comes early in Canada. The Toronto Stock Exchange and Canadian banks will be closed on Monday of this coming week in observance of the Canadian holiday. But the September employment figures for Canada hit the wire at the same instant that it did in the United States.
Over the past year or so, Canada’s labor market has been adding jobs at about as fast a rate as it has at any point in the past decade. While monthly jobs number can be notoriously volatile in Canada, the 6-month moving average plotted in the bottom graph shows sustained job growth north of 25K for the better part of the past year. September jobs numbers were a bit softer at 10K due to a loss of momentum in the third quarter. This is consistent with our expectation for growth in Canada to moderate in the second half.
Global Outlook
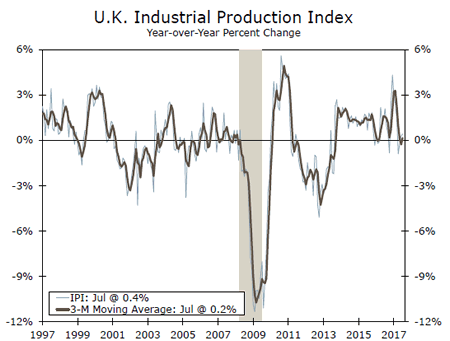
U.K. Industrial Production • Tuesday
After a strong finish to 2016, industrial production growth in the United Kingdom has languished for most of 2017. A weak pound has likely been a tailwind for British manufacturers, as have the stronger growth environments in the global economy generally and the Eurozone specifically. However, the uncertainty related to the ongoing Brexit negotiations has likely been an offsetting headwind as some businesses delay making capital investments until there is more clarity. Construction output, which is also reported next Tuesday, has fallen in four straight months, with another decline in August expected by the Bloomberg consensus.
That said, manufacturing output in the U.K. increased in July for the first time in 2017. For August, the Bloomberg consensus expects a 0.3 percent gain in manufacturing output and a 0.2 percent increase for industrial production as a whole, which, if realized, would mark the first back-to-back monthly gains since late 2016.
Previous: 0.4% Consensus: 0.9% (Year-over-Year)
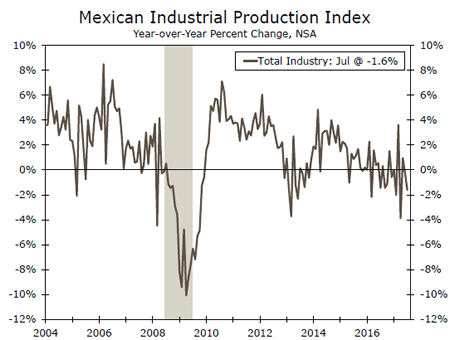
Mexican Industrial Production • Thursday
Industrial production growth in Mexico was weak in July, declining 1.0 percent over the month and 1.6 percent over the year. Construction, mining and utilities output all declined in the month, although manufacturing production managed to eke out a 0.3 percent gain. The all-important automobile sector has helped carry industrial production growth in Mexico; automobile, light trucks and parts production increased 9.8 percent on a year-earlier basis. Production in this sector is decelerating, however, as auto demand has softened in the United States, which generates most of the demand for Mexican autos.
The threat of NAFTA renegotiation continues to loom in the background for the Mexican economy, but thus far economic growth has managed to hold relatively steady despite a sharp depreciation in the peso that only began to reverse itself earlier this year and headwinds related to NAFTA uncertainty.
Previous: -1.6% Consensus: -0.5% (Year-over-Year)
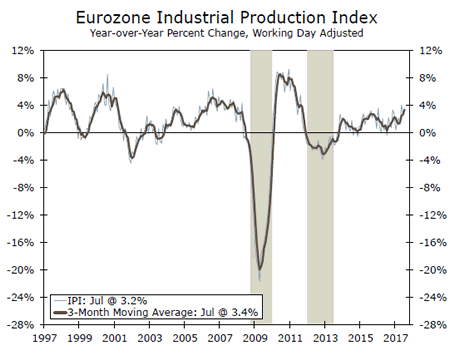
Eurozone Industrial Production • Thursday
Unlike the United Kingdom, industrial production in the Eurozone has been accelerating of late, reaching 3.2 percent year-over-year in July. Encouragingly, although the July monthly gain was just 0.1 percent, output in cyclically-sensitive industries such as capital goods and durable consumer goods rose 0.8 percent and 0.7 percent, respectively. The gains have coincided with a continued improvement in the survey data; the purchasing managers index for Eurozone manufacturers touched 58.1 in September, the highest reading since February 2011.
In the policy statement that followed its September meeting, the Governing Council of the European Central Bank acknowledged that the economic expansion in the euro area "continues to be solid and broad-based across countries and sectors." We look for the Governing Council to announce a further reduction in its monthly asset purchase rate at its October 26 meeting.
Previous: 3.2% Consensus: 2.6% (Year-over-Year)
Point of View
Interest Rate Watch
Squeeze Play
Interactions between monetary policy intentions and the expected pattern of federal deficits represent a squeeze play on financial markets as we look ahead into 2018 and develop our annual outlook for next year.
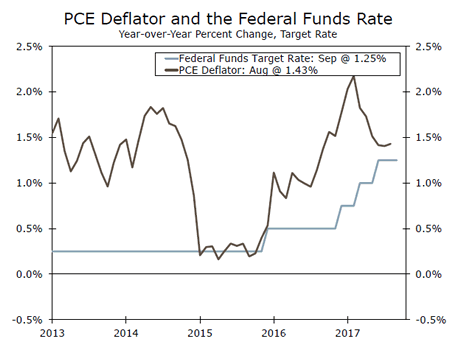
Inflation and Fed Funds Squeeze
Looking ahead, the spread between the pace of inflation, measured by the PCE, and the Fed funds rate has diminished significantly over the last year as illustrated in the top graph. This narrowed margin indicates that, looking into 2018, the real Federal funds rate will move into positive territory, and we have not experienced positive real short-term rates since the 2005-2007 period. As a result we are cautious on the pace of economic growth if 1) inflation does not accelerate but 2) the FOMC pursues its current dot-plot indicated path for the funds rate.
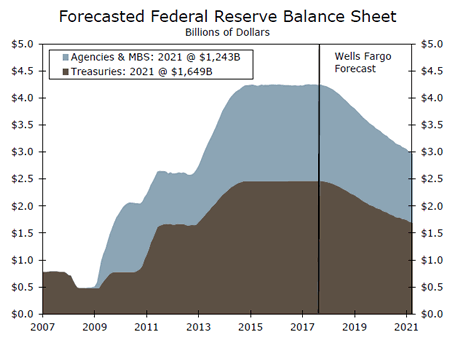
Fed Balance Sheet and Federal Deficits
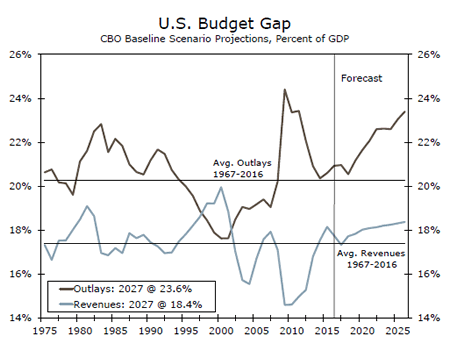
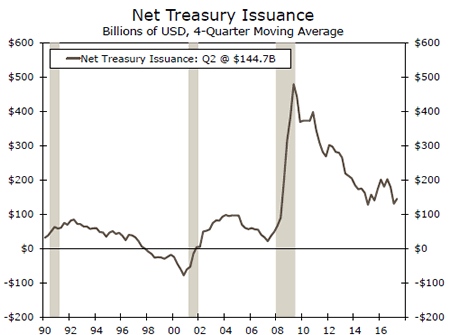
As illustrated in the middle graph, by the middle of 2018 and through 2019, the Fed’s intention to shrink its balance sheet will imply that some additional U.S. Treasury issuance will hit the market relative to the past. The issue comes with the rising projection of federal deficits/financing from the Congressional Budget Office. The conflict is clear; rising debt supply in the face of declining Fed demand.
Federal Debt—At Normal Interest Rates?
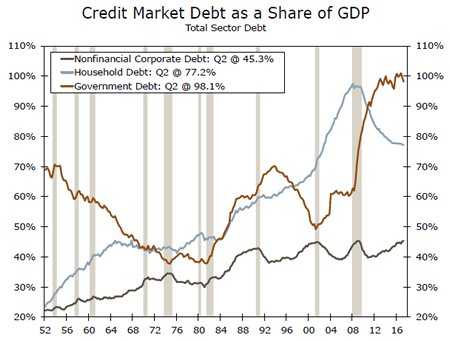
As illustrated in the bottom graph, since 1982, the growth in debt has been a greater issue for the government sector than for the nonfinancial corporate sector. Over that period, government debt has grown from 40 percent to 100 percent of GDP while nonfinancial corporate debt has moved from 30 percent to 45 percent. Meanwhile, the severe correction in the household debt situation since 2008 is fairly clear.
Moreover, federal debt is not meanreverting, that is, they are not returning to a steady percentage of GDP. One possible implication of this debt burden is that any downturn in the economy would likely be accompanied by a rising debt burden.
Credit Market Insights
Homeownership Rates Fall Further
Homeownership rates continued to drop across broad demographic groups from 2013 to 2016, according to the triennial Survey of Consumer Finances. Nationally, the percent of families owning a primary residence fell 1.5 percentage points to 63.7, marking continuous declines since the 2007 survey. However, the most recent quarterly data shows homeownership rates stabilizing, so 2016 may be a bottom.
Of note is the breadth of homeownership declines across demographic groups, whether by age, region, income or family structure. Explanatory factors include tighter lending standards, reduced affordability from rising home prices and a lack of supply of new housing in desirable markets. In addition, rising student loan debt and delayed family formation mean that younger buyers in particular are entering the housing market at historically slower rates. Only 33.1 percent of families under age 35 owned a home in 2016, compared to 41.6 percent in 2004.
Some of the only groups to see increased homeownership rates in recent years are families in rural areas and above age 75. Housing outside metro areas has remained more affordable and older Americans are increasingly choosing to age in place, which can help explain these trends.
Looking forward, wage gains stemming from a tightening labor market and families aging into cohorts more likely to own homes may support homeownership rates, or at least keep them stabilized.
Topic of the Week
Tax Details Finally Begin to Emerge
Last week, top Republican officials released their proposal to reform the tax code. Highlights of the plan included a doubling of the standard deduction, a consolidation of current tax rates to three brackets of 12 percent, 25 percent and 35 percent and the removal of "most" deductions except home mortgage interest and charitable contributions. On the business side, the proposal lowers the top corporate rate to 20 percent, introduces full expensing of capital investments for "at least five years" paired with a "partial limitation" of net interest expense for corporations. The proposal also creates a 25 percent rate for pass-through businesses.
Our readers should bear in mind that last week’s proposal is just that: a proposal that has no binding impact. This plan is an opening bid that will likely have multiple iterations to come, just as occurred with the Affordable Care Act repeal-and-replace effort.
In our view, the likelihood of this proposal passing in its current form is unlikely. The real challenge boils down to this: the Republican plan is aggressive in its tax cutting efforts, making the plan very costly in the absence of revenue raisers, which have yet to be fully fleshed out and will likely raise some strong policy disagreements. We maintain the view that the only provisions likely to become law are a doubling of the standard deduction, an increase in the child tax credit, a lowering of the corporate rate to 25 percent and a repatriation tax holiday on corporate profits.
As of this writing, the House has passed a budget resolution and the Senate Budget Committee has advanced their version, with a full Senate vote expected in a few weeks. They will next need to come together and hammer out the differences between the two bills to proceed with tax reform through the reconciliation process. Once complete, the respective tax writing committees can get to work on drafting legislation, with the goal of producing a bill roughly one month from now. Stay tuned. For more on our tax outlook, see "Our Fiscal Policy Assumptions: An Update" available on our website.