
The Federal Reserve Bank has been on an aggressive tightening path since March 2022. A total of 425 bps of rate hikes have pushed the Fed Funds Rate to 4.25%, the highest level since December 2007. The market is pricing in an extra 58 bps of rate hikes by June 2023, but numerous forecasters have been quite vocal that the Fed could be making its last tightening move in the first quarter and then opting to pause. It appears quite plausible for the Fed to eventually pause and allow the economy to absorb the higher interest rates. Sectors that are dependent on interest rates, like the housing sector, had fared negatively in 2022, elevating concerns about their 2023 performance.
Three rate hiking cycles since 2000
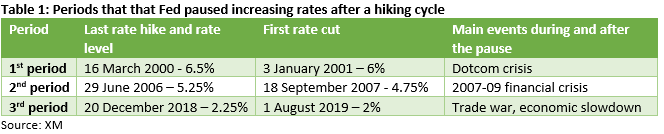
Since 2000 there have been three periods that the Fed completed its rate hiking cycle and then paused. Table 1 below presents these three instances and the main events during and after its pause. Interestingly, during the last 22 years the Fed has delivered 36 rate hikes with an average move size of 33bps. On the other hand, 26 rate cuts have been announced but the average move size was much higher at 46 bps.
Key similarity in these periods is the ensuing recession
The famous dotcom crash occurred just before and continued during the 2000-2001 Fed pause, eventually wiping out $5trillion from stock markets’ capitalization. By October 2002 the Nasdaq index had dropped 78% from its peak. Unsurprisingly, a short-lived recession ensued lasting from March 2010 to November 2001.
Similarly, the 2007-09 financial crisis began during the 2006-07 Fed pause. The defaults by subprime lenders in the first quarter of 2007 were an early indication of the “financial typhoon” that hit the financial markets in August 2007 when two hedge funds were frozen. The end-product of this financial crisis was the Euro area sovereign debt crisis and the accompanied euro periphery bailouts. The National Bureau of Economic Research (NBER) in the US has identified the December 2007 – June 2009 period as the longest-running recession since the 1929-1933 economic crash.
Thirdly, another recession followed the 2018-19 Fed pause. The pause in monetary policy tightening occurred amidst the trade war between the US and China, the aftermath of the NAFTA renegotiation (September 2018) and, more importantly, the first effort from the Fed to reduce its ballooning balance sheet. The first Quantitative Tightening (QT) operation started in October 2017 and was stopped abruptly in September 2019.
Duration of the pauses and projection to current timeframe
The duration of the Fed pauses has varied in the three periods examined. The 2000-01 pause lasted 10 months, the 2006-07 stop endured 15 months while the third pause had an eight-month life. Assuming that the Fed delivers its final rate move at the March 22 meeting then, based on its recent history, the projected pause would potentially end at some point between October 31, 2023 and June 9, 2024. Current market pricing points to a total of 52 bps of rate cuts in the second half of 2023, while there are increasing voices in the market that the anticipated recession would most likely force the Fed to cut rates even earlier and at a faster pace.
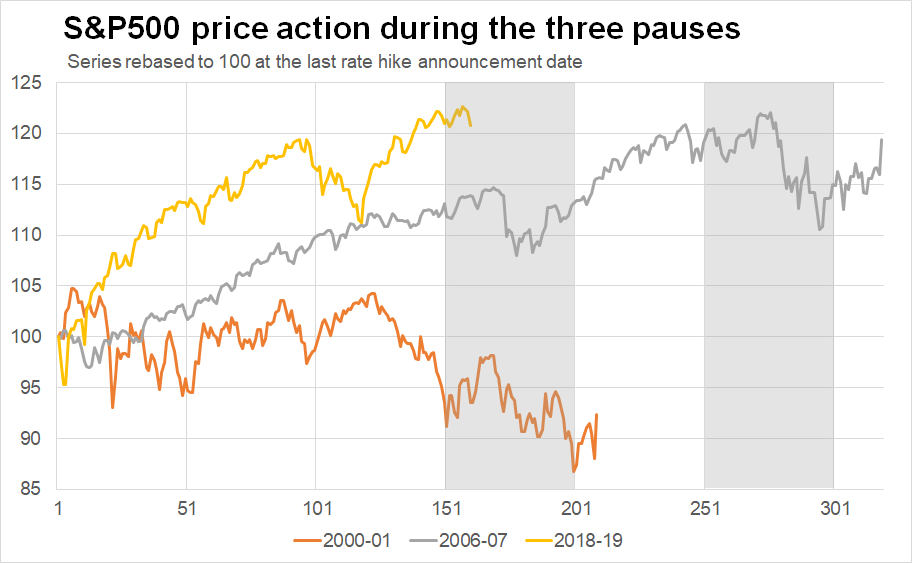
Price action in the three Fed pauses
We examined the performance in the three periods of stable monetary policy for various securities. Table 2 below presents the results. The immediate observation is that the 10-year US treasury yield sold off by 73-133 bps in these three periods, reversing part of the earlier move higher. The 10-year yield currently stands at 3.45% and could potentially drop to as low as 2.10% if history repeats itself.
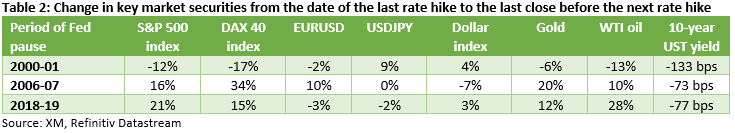
Stock markets reacted positively in the 2006-07 and 2018-19 pauses with an average advance of 18% and 24% for the S&P 500 and the DAX 40 respectively. But the same cannot be said for the 2000-01 figures that are negative due to the dotcom crisis. Similarly, both Gold and WTI oil prices recorded gains in the second and third periods, averaging gains of 16% and 19% respectively, but recorded losses in the 2000-01 pause.
Summary of our findings
With the market anxiously trying to forecast the Fed’s reaction function, we have examined the three instances that the Fed paused its rate hiking cycle. These pauses lasted from eight to 15 months, going against both the forecasters’ current expectations and market pricing of a rate cut during the second quarter of 2023. However, it is worth noting that the Fed stops occurred during or were followed by a recession in the US economy. These historical events lend some credibility to the advocates of an imminent recession. Finally, performance has been relatively mixed apart from the 10-year yield recording a drop of 73-133 bps in the examined periods. Interestingly, both the equity and commodity markets enjoyed strong returns in the 2006-07 and 2018-19 pauses.


