
Economists and market participants enjoy identifying indicators that, according to their analysis, reveal the future economic performance. Among the plethora of such indicators, the inverted 2-year/10-year (2s10s) US yield curve holds a special place in their hearts as it has predicted the most recent recessions. At the moment, the 2s10s US curve trades at an extremely inverted level that has been seen only twice in the past 40 years. What were the economic conditions that led up to this inversion in these two occasions, and what was the market performance after this inversion?
Curve inversion at extreme levels
Before delving into our findings, we have to acknowledge the fact that the period since December 2008, when the first Fed QE programme was implemented, has not been beneficial to the price discovery mechanism. Interventions by the key central banks globally have clearly distorted market pricings. Having said that, the US 2s10s curve is currently trading below -75 bps. This level of inversion was recorded in just two instances the past 40 years, in 1982 and the 2000. These periods are quite dissimilar when examining the economic conditions leading up to the curve inversion.
First instance: February 17, 1982
This period resembles a lot what the world has been going through for the past 1.5 years. Following the 1979 events in the Middle East, oil prices skyrocketed, pushing headline and core inflation rates to record highs. The then Fed Chairman Volcker tried to squeeze inflation by hiking rates, but two recessions took place during the January 1980-November 1982 period. The key difference with today’s situation is that in 1982 Fed officials were facing double-digit unemployment rates, the highest since 1941. Currently, unemployment rates are close to record low levels in most countries.
Second instance: May 4, 2000
The dotcom bubble burst in March 2000, which wiped out $5 trillion from stock markets’ capitalization, was one of the key culprits for the curve inversion. The aggressive hikes and the September 11, 2001 events pushed the US to a recession. It was relatively short-lived, from March 2001 to November 2001, and the economic impact in both inflation and unemployment was limited, a completely different situation to the one experienced now globally.
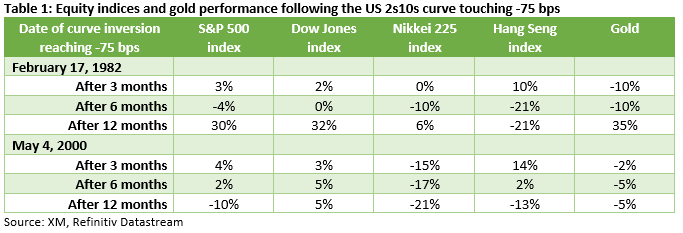
Performance three, six and 12 months after the curve inversion hit the -75 bps level
We have selected the specific level in order to identify the true points of severe curve inversion, and have analysed the performance of key assets in both the 1982 and 2000 periods. Table 1 above shows our findings for four stock indices and gold in an attempt to uncover common trends. The Dow Jones index appears to have positive performance in both periods and across the timeframes examined. Zooming in to specific timeframes, we can see a tendency by both the Nikkei 225 index and gold to underperform three and six months after this severe market inversion take places. Finally, the Hang Seng index appears to rally in the first three months post the curve inversion, but it underperforms significantly at the 12-month timeframe in both 1982 and 2000 periods.
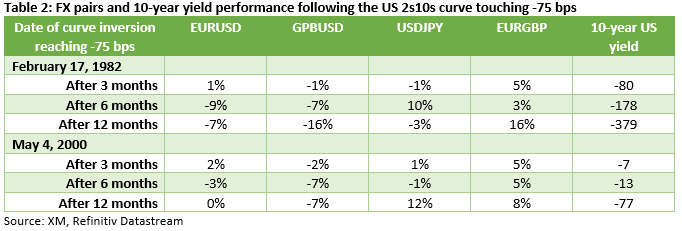
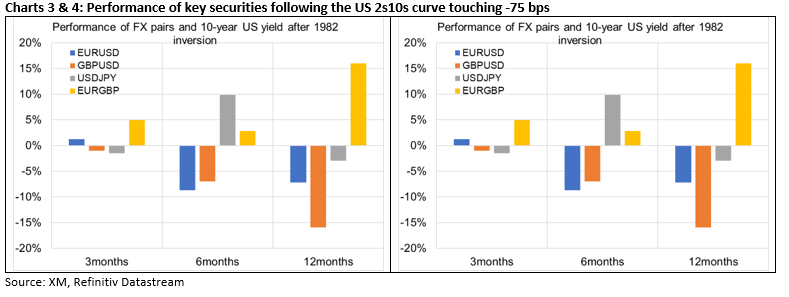
FX and yield performance: common themes arising
The 10-year US treasury yield is seen dropping in both periods and across the timeframes examined. The drop was more significant in 1982, but the 10-year yield was trading closer to 14.5% back then. Interestingly, the picture is much clearer in the FX world. Both the dollar and euro are seen outperforming sterling across the three, six and 12 months examined and in both the 1982 and 2000 periods, reflecting a lack of confidence for the UK in crisis times. Overall, our findings clearly point to dollar outperformance, which is not unexpected considering the safe–haven flows taking place in such periods.
To sum up, the US 2s10s yield curve is trading at extreme inverted levels only seen twice in recent history, in 1982 and 2000. In both periods a recession ensued, justifying the perceived predictive ability of the curve inversion. We had a look at the performance of key securities in the main asset classes post this severe curve inversion and four themes have emerged: 1) the dollar tends to outperform against the remaining major currencies, 2) the euro records gains against sterling, partly confirming its status as the second reserve currency, 3) the 10-year US yield appears to drop aggressively after the acute inversion is recorded, and 4) Dow Jones appears to have positive performance in both periods and across the timeframes examined.


