
U.S. Highlights
- A second read on fourth-quarter GDP showed that the U.S. economy grew by 2.7% (q/q annualized) instead of 2.9% as reported previously. A measure of underlying domestic demand was revised down from 0.2% to an even softer 0.1%.
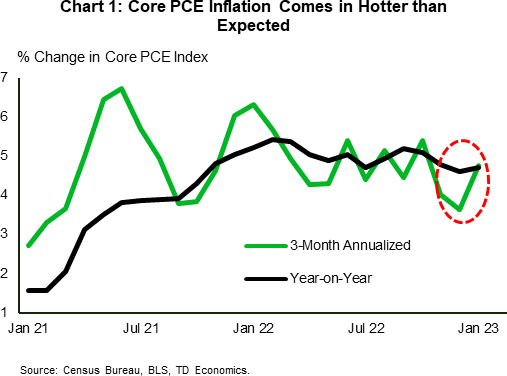
- Real consumer spending rose a solid 1.1% month-on-month (m/m) in January. Core PCE inflation came in hotter than anticipated, rising to 4.7% year-on-year in January from an upwardly revised 4.6% in December.
- Despite hopes for an improvement to the housing narrative at the start of 2023, existing home sales fell 0.7% (m/m) in January, extending their losing streak to 12 consecutive months.
Canadian Highlights
- CPI updates for January provided some respite from uncomfortable levels of inflation that far exceeded the Bank of Canada’s target. Interest rates are working their way through various channels to bring inflation down.
- Strong U.S. macro data likely influenced the Canadian rates picture. The increase in U.S. yields over the week dragged Canadian rates up in tandem, possibly distorting the effects of domestic developments that could support a moderating in Canadian rates.
- GDP figures for the fourth quarter are on tap for next week. The Canadian economy has shown resilience, but we expect momentum to continue to moderate into the year.
U.S. – Sticky Inflation Means Higher Rates
Not all economic data was positive this week, but a strong rebound in consumption and evidence of sticky inflation continued to build the case that the Fed will take the policy rate higher. Rising Treasury yields took a toll on equity markets, with the S&P 500 down 3.3% from last week’s close (at time of writing).
A second reading on fourth-quarter GDP showed that the U.S. economy ended 2022 on softer footing than previously reported. The headline measure was revised down from 2.9% quarter-on-quarter (q/q) annualized to 2.7%. Net exports and inventory investment, two inherently volatile components, continued to make up the bulk of gain, while final sales to private domestic purchasers – a measure of underlying domestic demand – was downgraded from 0.2% to an even softer 0.1%. This as consumer spending was shaved down noticeably from 2.1% to 1.4%.
However, January’s personal income and outlays report showed that consumer spending rebounded strongly to start the year. Real consumer spending rose 1.1% month-on-month (m/m) in January, reflecting gains in both goods and services. Following in the footsteps of a strong retail sales report, real goods spending rose a sharp 2.2% (m/m), while services spending rose 0.6%. Overall, this is a very good start to first-quarter consumption, which we anticipate will expand in the 1.5-2.0% (q/q annualized) range. A tight labor market, which is helping support healthy growth in wages and salaries, will also help in this regard.
The above report also provided an update on inflation. Total PCE inflation accelerated to 5.4% year-on-year (y/y) from 5.0% in December. The Fed’s preferred inflation gauge, core PCE, accelerated modestly, rising to 4.7% y/y from an upwardly revised 4.6% in December. The key point to highlight here is that core PCE inflation looks to have picked up some steam recently (Chart 1).
The fact that inflation is showing signs of stickiness and that the labor market remains hot, raises the odds that the Fed will need to take the policy rate higher and perhaps keep it there for longer. Minutes from the latest FOMC meeting, which showed members’ resolve to keep fighting inflation through additional rate hikes based on incoming data, helps further cement this view. Marked odds still favor a rate hike of 25 basis points (bps) at the March meeting, but odds for a 50-bps hike crept higher following the PCE report and are hovering around 33% as of writing.
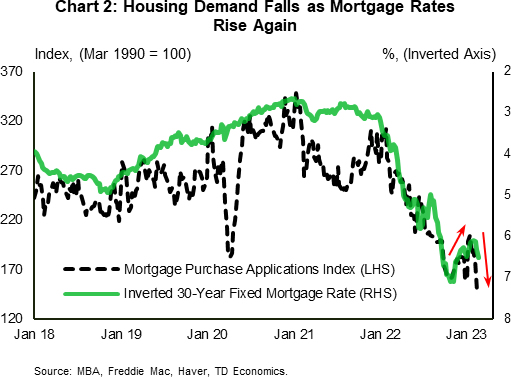
Among other things, a “higher for longer” policy rate, means that there could be additional fallout for interest-sensitive areas of the economy. On this front, existing home sales fell again in January (-0.7% m/m), extending the losing streak to 12 consecutive months. Since interest rate changes tend to influence sales activity with a lag, past declines in mortgage rates could drive some improvement in sales over the near-term. But given that mortgage rates turned higher again, housing activity will continue to be tested. High frequency data second this view, with mortgage purchase applications falling to a 28-year low last week (Chart 2). Indeed, it appears that the start of a new and improving trend in housing is still some time away.
Canada – A Slight Sigh of Relief
It was a busy week on the Canadian economic calendar with the welcome cooling in inflation in January the main event. The Bank of Canada’s (BoC) conditional hold on the policy rate has been tested by recent upside surprises from the labour market and consumer spending data. At this juncture, every new data point is critical to the further assessment of the BoC’s policy stance.
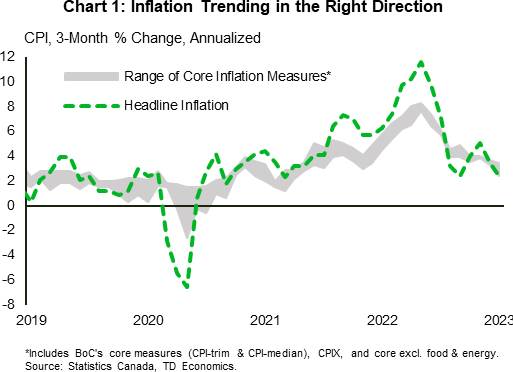
Headline inflation for January decelerated to 5.9% year-on-year (y/y), below the 6.1% consensus estimate and down from 6.3% in December. Core inflation pressures remain elevated but continue to ease. CPI ex-food and energy came in at 4.9% y/y, down from 5.3% in December. The BoC’s primary core inflation measures (CPI-trim and CPI-median) both ticked down two-tenths of a percent to 5.1% and 5.0% y/y, respectively. As we show in Chart 1, the trajectory of inflation is broadly evolving in line with the BoC’s objective of bringing prices back to their mandated 2% target.
Although current inflation is moving in the right direction, the path back to 2% may not be smooth sailing. Canadian economic growth continues to exhibit surprising strength. Retail sales ended 2022 on a high note, rising 0.5% month-on-month (m/m) in December with volumes up 1.3%. TD’s own consumer spending data suggests that the strength carried forward into January, with figures chalking up another gain. And it is not just domestic strength. The growth outlook for Europe and China has substantially improved, which can further slow the disinflationary impulse in Canada. See our updated Q&A for a complete discussion on the balance of risks around the inflation outlook.
This week we saw another leg higher in yields, with U.S. macro data showing incredible resilience (Chart 2). This upturn in economic data has reinforced the higher-for-longer policy rate narrative. Market pricing for the Canadian policy rate wavered a touch over the last several days but is still largely pricing in one more 25-bp hike by Q3-2023. Markets do not expect rate cuts to materialize in 2023. We are not as confident, as a slowdown in economic momentum is still on the horizon. If the data evolve consistently with our outlook, it is probable that the BoC cuts rates by the end of the year. We currently have a cumulative 50 bps of cuts penciled in for the fourth quarter.
The main event for next week is Q4 Canadian GDP growth. These figures will inform how the BoC’s forecasts in January’s Monetary Policy Report (MPR) are shaping up, while also providing a foundation for the hand-off into the first quarter of this year. Also keep watch on Q4 quarterly productivity figures. Productivity in Canada notoriously lags other developed economies, but any sign of a rebound could mean another strong quarter of growth is in the cards.


