
Headline CPI 1.4%qtr/7.0%yr; Trimmed Mean 1.2%qtr/6.6%yr; Weighted Median 1.2%qtr/5.8%yr. The more modest rise in the Trimmed Mean is highlighting that the current disinflationary force, particularly for goods, appears to be greater than we thought.
The March quarter CPI came in as broadly as expected rising 1.4%qtr (true it was above market expectation of 1.3% but it was on Westpac’s 1.4%) taking the annual pace down to 7.0%. The Trimmed Mean surprised coming in softer than expected rising just 1.2%qtr for an annual pace of 6.6%. Our end 2023 target for the Trimmed Mean is 3.7%yr. The ABS noted that while prices continued to rise for most goods and services, many of these increases were smaller than they have been in recent quarters.
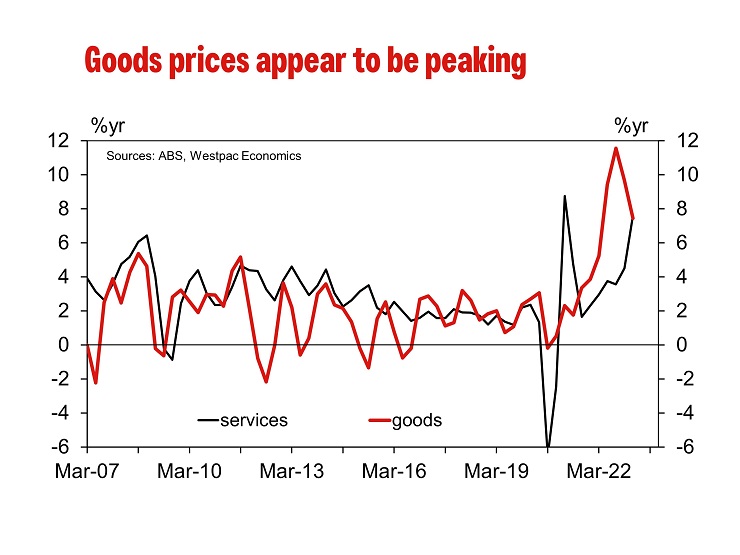
The more modest rise in the Trimmed Mean is highlighting that the current disinflationary force, particularly for goods, appears to be greater than we thought. For while services inflation is holding up, and is likely to prevent inflation falling back within the band in 2023 (and even in 2024 as per our current forecasts) it is not enough to prevent goods disinflation taking the annual pace of inflation back to close to the band by the first half of 2024.
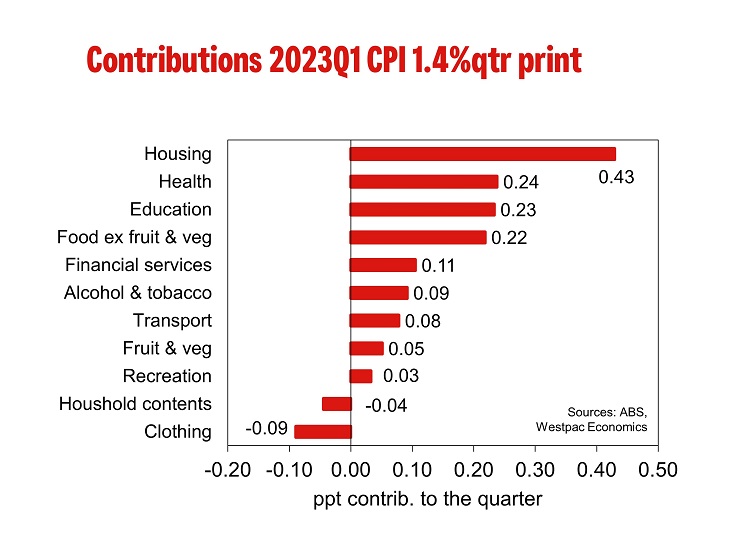
The most significant contributors to the March quarter rise were medical & hospital services (+4.2%), tertiary education (+9.7%), gas & other household fuels (+14.3%) and domestic holiday travel & accommodation (+4.7%). Partially offsetting the rise was international holiday travel & accommodation (-8.2%), as some destinations entered their off-peak seasons following significant rises in recent quarters. Also discounting by retailers resulted in falls across furniture (-4.6%), major & small appliances (-3.8%) and clothing (-3.2%).
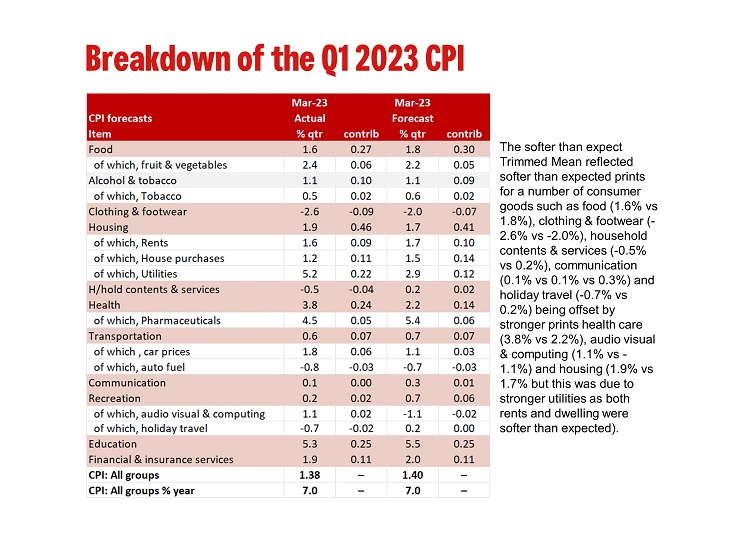
We have included a table comparing our forecasts to the actual print. While the headline print came in as we expected the softer than expect Trimmed Mean reflected softer than expected prints for a number of consumer goods such as food (1.6% vs 1.8%), clothing & footwear (-2.6% vs -2.0%), household contents & services (-0.5% vs 0.2%), communication (0.1% vs 0.1% vs 0.3%) and holiday travel (-0.7% vs 0.2%) being offset by stronger prints health care (3.8% vs 2.2%), audio visual & computing (1.1% vs -1.1%) and housing (1.9% vs 1.7% but this was due to stronger utilities as both rents and dwelling were softer than expected).
Annual goods inflation eased after two years of steady increases, from 9.5%yr to 7.6%yr, due to discounting on furniture, appliances and clothes and lower automotive fuel. Annual services inflation recorded its largest annual rise since 2001, driven by higher prices for holiday travel, medical services, rents and restaurant meals. Core market services excluding volatile items gain 0.9% in the quarter, a step down from the 2.7%qtr increase in December but historically March is a soft quarter. This is why the annual pace lifted to 6.8%yr from 6.4%yr (and compared to 2.5%yr in March 2022) with the six-month annualised pace lifting to 9.3%yr from 6.1%yr.
As noted earlier the pace of new dwellings inflation continues to ease following a record annual pace the September quarter. Lifting 1.2% this was softer than our forecast of 1.5% and well down on the 3.7% increase in December, 5.6% in September and 5.75 increase in March. The recent moderation in prices reflects improvements in the supply of construction materials, a softening in demand and the unwinding of various government construction grants.
There was no surprise in rents recording their fastest annual pace since 2010, reflecting strong demand amid low vacancy rates across the country; Sydney and Melbourne both recorded their strongest annual pace since 2012. In the quarter, the 1.6% gain was a gain from the 1.2% increase in December and the strongest increase since March 2009.
For gas & other fuels price reviews reflecting higher wholesale gas prices led to rises across all capital cities. In the quarter gas & other fuels lifted 14.3%, the strongest since September 2012 (14.2%) taking the annual pace to 26.2%yr, the strongest on record.
Electricity prices reviews hit the CPI in the September quarter. However, the respect price rises were partially offset by the introduction of electricity rebates in WA, QLD and the ACT. The unwinding of these rebates has seen the full effects of higher electricity prices reflected in the March quarter (3.0%qtr/15.5%yr).
Auto fuel fell 0.8%qtr with unleaded fuel unchanged and diesel prices –10.3%qtr. While fuel prices remain high it has been a year since Russia invaded Ukraine which saw prices jump 11.0% in the quarter so prices are up just 1.1% in the year to March 2023; it was 13.2%yr in December.
Non-discretionary inflation includes goods & services that households are less likely to reduce their consumption of, such as food, automotive fuel, housing and health costs. Non-discretionary goods & services rose 1.9%qtr/7.2%yr due to medical 7 hospital services (+4.2%), gas & other household fuels (+14.3%) and new dwellings (+1.2%). Discretionary goods & services lifted 0.6%qtr/6.8%yr driven by tertiary education (+9.7%), domestic holiday travel (+4.7%) and motor vehicles (+1.8%).


