
US markets made an impressive surge last week, taking the S&P500 to 4200, a crucial turning point. It is worth preparing for an upside stop or correction before the index steadily moves to the next level.
The S&P500 index has stopped near the 4200 level many times in the last two years. There was a pause on the way up from April to June 2021; then, it became significant support in March and May 2022; and over the last twelve months, it has been the resistance level.
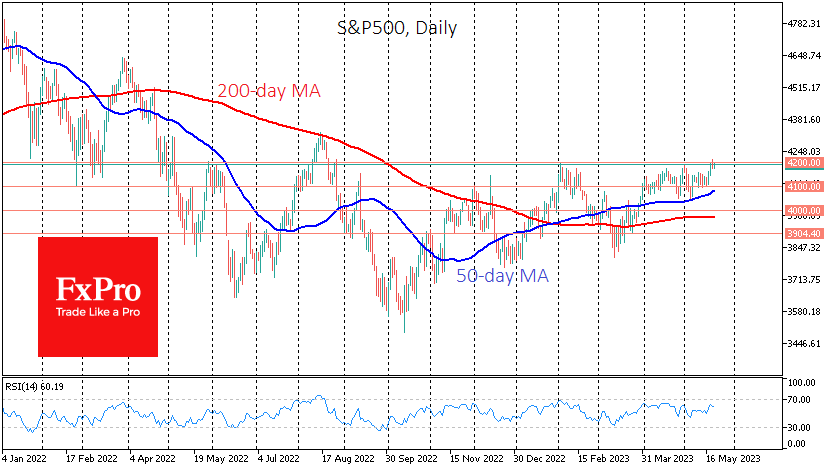
At the start of May and in trading on Friday, the S&P500 retreated from this level again. The appropriate info trigger is required to take a major tactical level, but the lack of progress in the debt ceiling negotiations on Friday formed the mood for profit-taking.
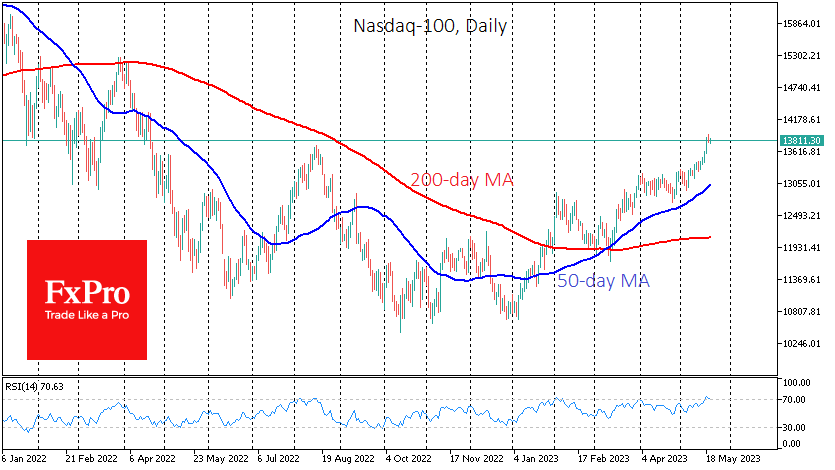
Although S&P500 doesn’t look overbought after last week’s rise, on the daily timeframes, the Nasdaq100 reversed on Friday just after touching the overbought zone in RSI. The high-tech index was experiencing a rally on the AI theme, but even more, investors were attracted by the financial performance of technology heavyweights. They have been vulnerable to rate hikes in previous years but have performed impressively during the current reporting season. But that rally is ending, and profit-taking in the Nasdaq100 looks to be reason enough for a local correction in the broad market.
The US debt ceiling drama is starting to look more and more like the most dramatic scenario we saw in 2011, where the market lost around 20% from the peak to the bottom. Interestingly, it peaked near the original ceiling date (now 1 June). However, investors and traders should be aware that due to tax receipts and other measures of the US Treasury, there is time for discussions until mid-August. And lawmakers appeared to get the most out of this time, trying to score points before next year’s presidential election.
On the technical analysis side, the S&P500 index has the potential to correct to the 4100 area without breaking its medium-term rising trend. The 50-day moving average passes through here. In a more extreme case, the pullback might occur towards the area of 4000, where the 200-day MA is located. In addition, this level carries a specific psychological load. The level of 3800 is achievable if the economy experiences a sharp decline in addition to the debt ceiling drama.
It is doubtful that the S&P500 would lose 20% and bounce back to 3350 on the sovereign debt story, as this level would not have the same devastating effect again.


