
U.S. Highlights
- The Federal Reserve met expectations and held the policy rate steady at 5.0-5.25%, but left the door open to further rate hikes later this year.
- The Fed’s Summary of Economic Projections underscored a more optimistic outlook, and an upward revision on the future path of the fed funds rate to 5.75% (previously 5.25%).
- Retail sales data for May came in stronger than expected, underscoring a still resilient consumer. Inflation data came in on expectations, with the headline and core measure up 4.0% and 5.3%, respectively.
Canadian Highlights
- Canadian households gained $520 billion as wealth growth accelerated in the first quarter of 2023.
- Wealth growth was supported by a rebound in real estate values as average home prices rose on the back of strong home sales and weak listings.
- Meanwhile, higher interest rates lifted the debt service ratio back to its pre-pandemic level. In response, Canadians extended the overall duration of their liabilities.
U.S. – Keepin’ At It… For Now
There were few surprises on the economic front this week. As widely expected, the Federal Reserve held the policy rate steady, after 10 consecutive increases over the past 15 months. Little changed in the statement, though the revised Summary of Economic Projections (SEP) underscored a more hawkish trajectory for the fed funds rate. And rightfully so. Retail sales and inflation data out this week continued to reflect a degree of inertia still present in the U.S. economy, which will likely necessitate a bit more ‘work’ from the FOMC through the remainder of this year.
Focusing on the major changes in the SEP, the FOMC revised its economic outlook higher for 2023. Real GDP growth is now expected to be 1.0% by year-end (previously 0.4%), and the unemployment rate was lowered to 4.1% (previously 4.5%). The inflation outlook was also revised higher, with the median forecast on core PCE now at 3.9% (previously 3.6%). With a stronger economic outlook and higher expected inflation, the median projection on the future path of the policy rate was raised by 50-bps to 5.6% – suggesting a terminal policy rate of 5.75%.
At the subsequent press conference, Fed Chair Powell was pressed on the timing of the potential future rate hikes. While remaining non-committal, Powell emphasized that the July meeting remained ‘live’, and the decision would ultimately be determined by the ‘totality’ of the data flow. From that perspective, a July hike seems more likely than not.
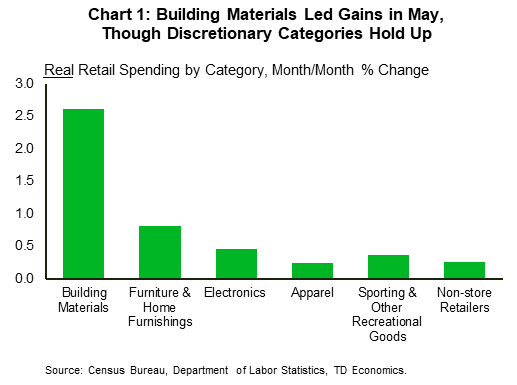
Data out this week on retail sales showed that consumer spending is still humming at a decent clip. Total retail sales rose 0.3% m/m in May, well ahead of the consensus forecast calling for a pullback of 0.2%. After stripping out food and gasoline, sales were even stronger – rising 0.4% m/m. While gains were led by building materials – an inherently volatile category – there was enough breadth across other discretionary categories to suggest that the ‘resilient’ narrative remains intact (Chart 1). Our current tracking for Q2 spending sits between 1.5%-2%. While this represents a deceleration from Q1’s 3.8%, spending is still running far too hot to meaningfully cool inflation. This was evident in the May inflation data.
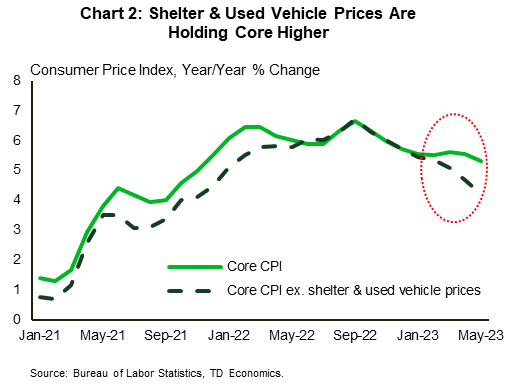
CPI rose by just 0.1% m/m, though the more subdued headline reading was the result of falling energy prices and slower food inflation. Core inflation (excludes food & energy), rose by a more notable 0.4% m/m with the 12-month change ticking down just 0.2%-pts to 5.3%. Sizeable contributions from both used vehicle prices and shelter were responsible for much of last month’s core gains. Excluding these two items shows a more subdued pace of price growth, with prices up just 0.1% m/m or 4.2% y/y (Chart 2). While stripping out individual categories is sometimes a dangerous game to play, there’s good reason to believe that both have downside over the coming months. This reinforces the notion that getting inflation down from today’s +5% reading to 3% over the next year is very feasible. It’s the last leg lower (from 3% to 2%) that will be the biggest challenge for the Fed, hence the need for policymakers to ‘keep at it’ for the time being.
 Canada – Balancing Assets, Liabilities, and the Future
Central banks’ actions continued to underpin market sentiment this week with the Bank of Canada’s surprise rate hike giving way to the Fed’s hawkish tone as it kept rates unchanged. The news helped lift the Canadian dollar as the interest rate differential between the two countries tilted in loonie’s favour. Meanwhile, S&P/TSX Composite index moved almost 1% higher (at the time of writing), with gains extending for the second consecutive week.
Monetary authorities prefer to remain hawkish as evidence of strong labour markets, sticky inflation, and a recovery in asset valuations continues to amass. This week’s release of national balance sheet and financial flow accounts showed that national net worth (the sum of national wealth and Canada’s net foreign asset position) rose 1.7% from the fourth quarter of 2022 to $17.1 trillion at the end of the first quarter of 2023. Canadian household net worth grew by $520 billion as wealth growth accelerated by 3.4% in Q1 from 0.9% in Q4 2022. These gains were preceded by two consecutive quarters of contraction, triggered by one of the most aggressive tightening cycles in the history of the Bank of Canada.
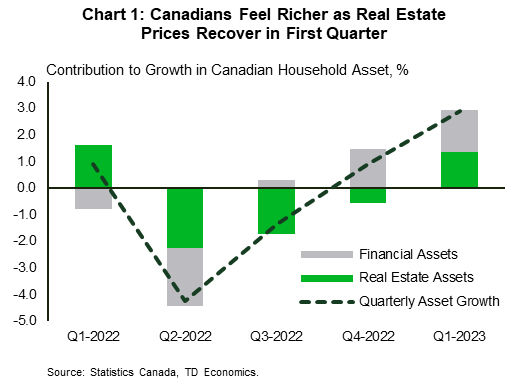
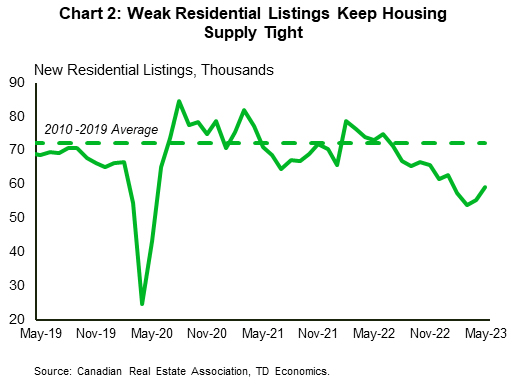
On the asset side of households’ balance sheet, growth was supported by both a rebound in real estate and higher financial assets valuations. Indeed, average home prices turned the corner in February stepping on an upward trend, gaining 2.7% in the month of May and 14% since the beginning of the year. Home price gains have been driven by exceptionally tight supply dynamics, where home sales recovered more than 20% since the beginning of the year while listings remained weak at 16% below their post-Global Financial Crisis average (Chart 2). Despite these visible signs of a housing market resurrection, past declines in home sales continue to feed into falling construction, pushing housing starts lower in May. This is likely to reverse in the coming months, as more recent gains in sales reboot residential investment activity, supporting the overall economy.
As Canadians started buying homes again, the pace of accumulation in bank deposits slowed significantly in the first quarter of 2023, with the smallest gain since the third quarter of 2021. The pace of debt accumulation was also slower, with both mortgage and non-mortgage debt growth decelerating. This reflects the slow-moving nature of tighter monetary policy that also helped lift the debt service ratio (total debt payments as a share of personal disposable income) back to its pre-pandemic level. In response, Canadians lowered their debt principal repayments by 4% quarter-on-quarter, extending the overall duration of their liabilities.
This can have several implications for the Bank of Canada’s future policy decisions. As a larger portion of individuals’ income goes towards debt repayment, their disposable income for consumption and investment decreases. This should help slow demand, and in turn cool inflation. On the flip side, slower debt repayment leaves households more leveraged which weighs on consumption over the longer term.


 underscored a more hawkish trajectory for the fed funds rate. And rightfully so. Retail sales and inflation data out this week continued to reflect a degree of inertia still present in the U.S. economy, which will likely necessitate a bit more ‘work’ from the FOMC through the remainder of this year.)