
August is traditionally seen as a quiet month, but once again significant developments are taking place globally. In particular, the 10-year US yield has climbed decisively above the 4% threshold as market participants are scrambling to explain this move amidst a low liquidity environment. A quick look at market history could give us some valuable insight as to what the future holds for euro-dollar and other key market instruments.
Significant developments everywhere
The market has once again proven that it does not pay much attention to the calendar. And understandably so, as the Chinese developments are making headlines with the world, and especially the euro area, appearing to be deeply worried about the growth outlook for the remainder of 2023. Amidst these conditions, the 10-year US yield is trading comfortably above the 4% threshold, testing the October 2022 highs, and potentially opening the door to recording the highest print since October 2007.
It is worth pointing out that an entire generation of bond traders has not experienced yields trading consistently above 4%. Coupled with the fact that the summer holidays have left the junior traders in charge of the investment banks’ trading books, it makes this period extremely interesting and far more volatile than under normal market conditions.
Having said that, there are several economic and liquidity reasons behind the current rise in US treasuries. These include the strong economic data releases in the US and the rising probability that inflation might not continue its recent downward trend. This could mean that the Fed is not getting closer to considering rate cuts as the market is currently envisaging. If one adds the higher number of US Treasury bonds/notes being auctioned off to refill the government coffers and to fund the ballooning budget deficit, then the 4% level is not difficult to explain.
What happens to euro-dollar when the 10-year UST traded above 4%?
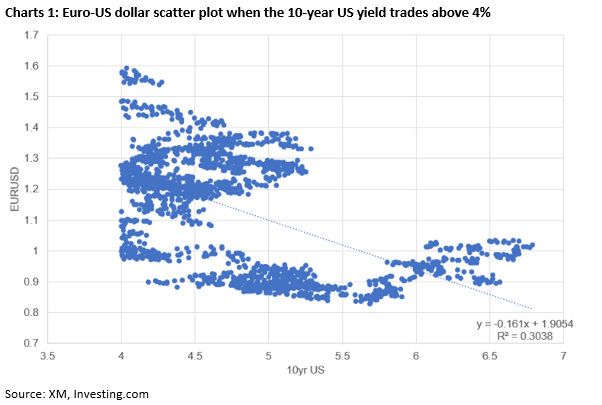
Chart 1 below shows a scatter chart of euro-dollar price action when the 10-year US yield trades above 4% using data since 2000. We can see a decent negative relationship which should be taken into consideration as the 2023 year-end forecasts are currently being updated.
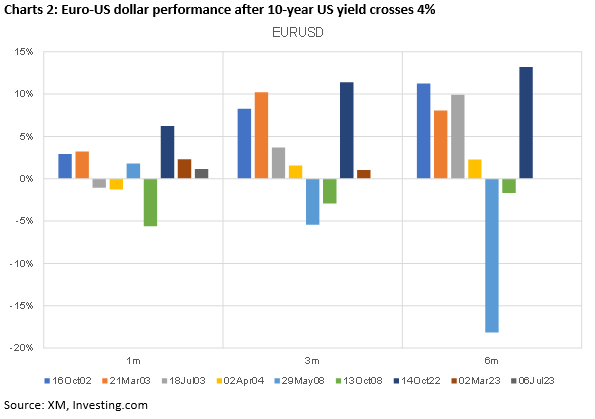
Moving a step further, we decided to look at the 1-month, 3-month and 6-month performance of euro-dollar when the 10-year US yield crosses above 4%. Naturally, this condition created a lot of noise as the number of days appearing in our analysis was quite sizeable. Therefore, our decision was to examine the periods that the 10-year US yield crossed above 4% provided that it spent the previous 20 trading days below this level.
As we can see from Chart 2 below, with the exception of the 2008 episode, euro-dollar performance tends to be positive 3 and 6 months after the 10-year US yield trades above the 4% threshold. The 1-month performance is more mixed and hence probably not a good guide for future episodes.
Any other interesting findings?
By analysing other key market instruments, we found the S&P500 performance to be mixed and rather split between positive and negatives episodes. Hence, avid stock investors should be aware that a higher 10-year US yield doesn’t automatically imply negative future stock market performance. Interestingly, 10-year US yield performance is equally split when focusing on the 6-month move. We have found three periods of very small yield increases ranging from 2.7-5.2bps but also four periods of significant drops of up to 122bps.
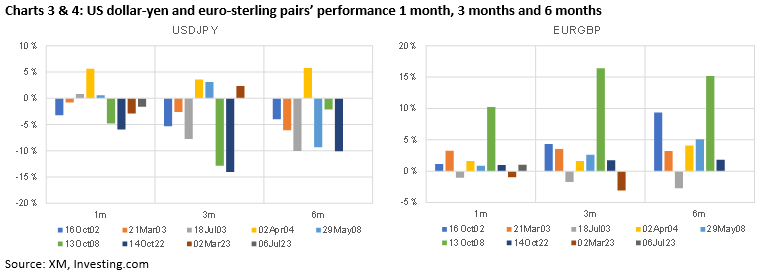
From the remaining instruments examined, the 6-month performance of gold, dollar-yen and euro-pound stands out. Intriguingly, gold tends to be higher 6 months after 10-year US yield trades above 4% with the exception of the May 2008 period. Additionally, the performance of both dollar-yen and euro-pound pairs 6 months after the acute US yield move seems to be consistent, with the former showing an average 7% drop over the dates examined and the latter registering a 6.5% advance on average.
To sum up, it has been quite rare over the past 15 years for the US yield to hover above 4%. Consequently, the lack of relevant market experience under this condition creates uncertainty about the future performance of the key market instruments. Based on our analysis, the 6-month performance of euro-dollar after the 10-year US yield trades above 4% tends to be positive with the exception of the 2008 crisis. Additionally, S&P500 investors are not yet doomed as there have been periods of positive performance despite the elevated 10-year US yield. Finally, from the remaining instruments, dollar-yen and euro-pound exhibit consistent 6-month performance.


