
- Surprise indices are an easy way of mapping the current state of an economy
- Our index confirms that the US economy has been losing steam the past few weeks
- Could EURUSD moves be explained by our surprise indices?
Theory states that the price of financial assets should reflect the underlying economic conditions in the respective region. While this tends to occur from a long-term perspective, a good chunk of the movements occurring in the short-term are dictated by sentiment and the impact of surprises by economic data releases.
Without aiming to steal the thunder from more established surprises indices, we created economic surprise indices for the US, the UK and Germany; the latter one is used as a proxy for the euro area. Our intention is to (a) identify the current state of economic surprises in each region, (b) compare the different regions, and (c) examine whether these indices confirm or even lead the performance of key financial assets.
We have used economic releases since 2013 and have assigned different weights to the more market-moving data. For example, the preliminary release of PMIs surveys has a greater weight in the index compared to other smaller and less market-moving business surveys. Similarly, data releases with no market forecast have the lowest possible impact on the surprise indices. It is worth noting that by surprise we refer to any economic data release significantly diverging from the economists’ forecast; thus a surprise could be positive and negative.
US, UK and German surprise indices – interesting findings
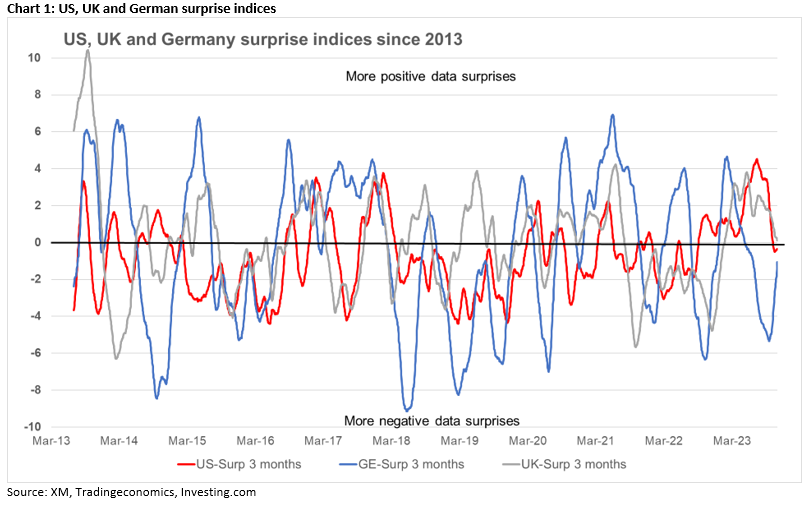
Our brand-new surprise indices, using a 3-month rolling period of economic data releases, are presented in Chart 1 below. According to our findings, only the UK index is in positive territory. This means that over the past 3 months data releases in the UK have mostly been stronger than their previous prints, and that data surprises have been more positive than negative. However, this trend appears to have changed lately, as the UK index is on a downward path with the negative surprises multiplying.
The same kind of worsening is more evident in the US surprise index. As seen in Chart 1, the US economy was at its strongest position during the summer. However, it peaked on July 17, and it has been aggressively moving lower since then. It is currently a tad below the zero line, as the recent data releases have been worsening and producing marginally more negative surprises compared to expectations.
Similarly, the German surprise index is currently hovering at a low level. However, since mid-September this index has been on an aggressive upward trend, pointing to an improvement in data releases despite the bleak short-term economic forecasts from various German think tanks.
We have to highlight the fact that economists tend to become more optimistic especially when the economy is assumed to be progressing well. This potentially gives rise to more negative surprises. This attitude is also shared by central banks when examining their forecasting record. For example, the ECB tends to produce inflation projections that show that the Bank is close to its target at the end of the forecasting window examined, despite its recent dismal record.
Euro/dollar and the surprise indices
The key motivation for the creation of surprise indices is to unmask any possible correlation with key market assets. Therefore, we tried to tie up the recent trend of the surprise indices with the performance of instruments like the EURUSD. Interestingly, the progressive and significant divergence of the US and the German surprise indices over the summer, seen quite clearly in Chart 1 above, can explain to a certain degree the strong bearish move recorded in EURUSD during the July-September period. More recently, the converging US and the German surprise indices are bound to have played a role in the EURUSD upleg registered since early October.
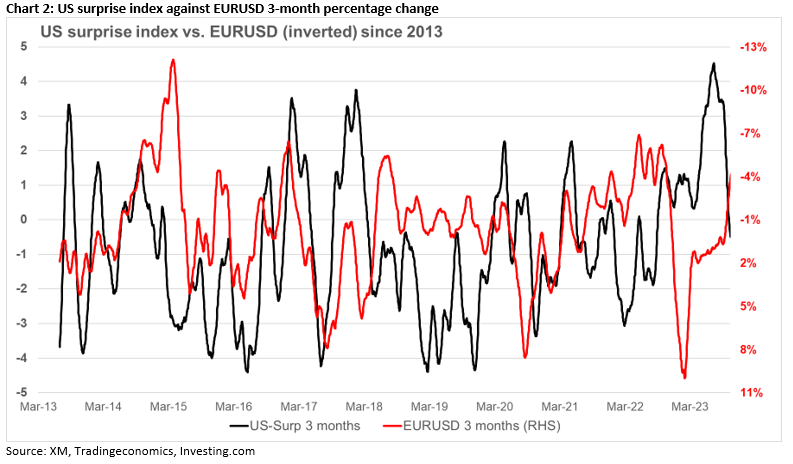
The long-term relationship between the US surprise index and EURUSD is presented in Chart 2 below and, at times, the negative correlation tends to be rather strong. Interestingly, since the start of 2023 this correlation has been strengthening as strong US data releases fueled the sell-off in EURUSD. A growing US economy, especially when other developed economies are going through a rough patch, tends to attract global investor interest. This situation increases demand for the US dollar, as investors want to take advantage of investment opportunities. However, since early September, this relationship turned positive, potentially pointing to other factors being behind the recent EURUSD move.
S&P 500 cash index driven by the surprise indices?
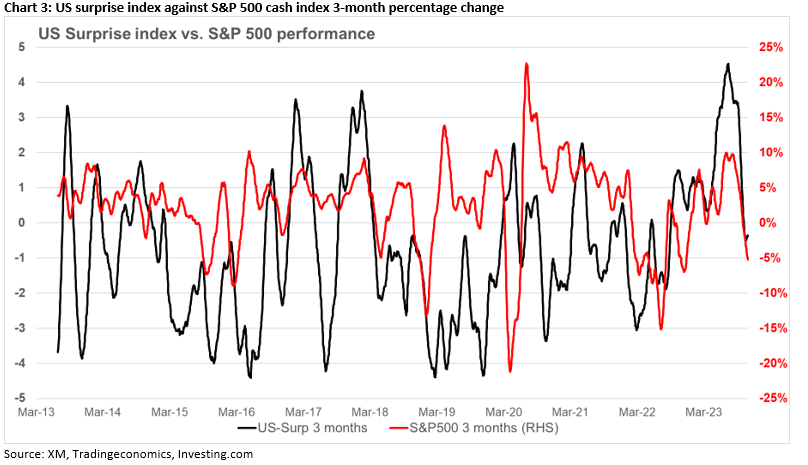
Like EURUSD, there appears to be a strong relationship between the S&P 500 cash index and the US surprise index. Since early-2023 this relationship has been getting stronger with the current correlation being very close to 1, the strongest possible positive correlation. This situation is expected as the stock market, at normal times, reflects the current economic conditions and the market participants’ expectations about the future. Therefore, we can assume that the S&P 500 rally during 2023 was fueled by consistent upside surprises in US data.
To sum up, our first attempt to create surprise indices for the three key developed economies has produced some interesting findings. The UK appears to record the best economic surprise score at this stage with Germany still hovering at negative territory and the US recently experiencing an aggressive weakening in its economic data prints. This difference between the US and the German surprise indices can explain at a great length the EURUSD performance during the until late September. Finally, in terms of equities, the US surprise index is currently very strongly positively correlated with the S&P 500 cash index.


