
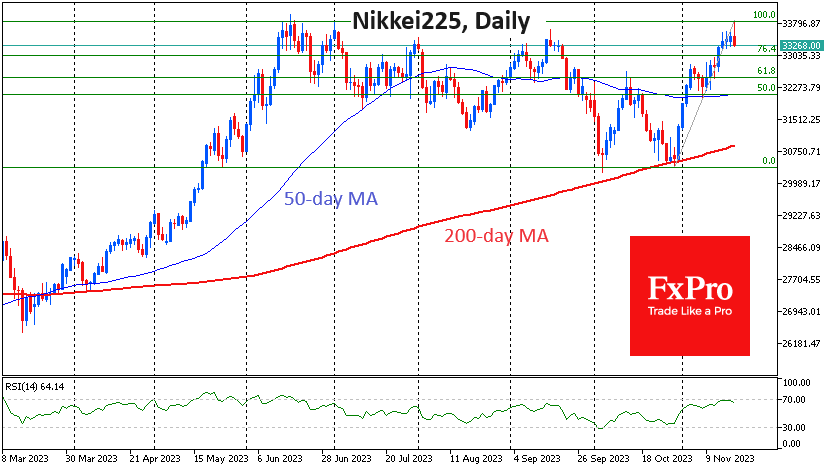
There are significant moves in the Japanese markets today. The Japanese stock market started the day with a rise of over 1%, taking the Nikkei225 to 33850. It was the second brief climb to this height since June, last seen 33 years ago. Touching the highs triggered a sharp sell-off, and the index is now down 0.6% from the day’s open, which could be the start of a broader correction or a prolonged pullback.
The Nikkei225 is behaving classically according to the laws of technical analysis on a daily timeframe. In October, the index rallied after several days of testing support at the 200-day average. The divergence between the RSI and the price also favoured the bulls.
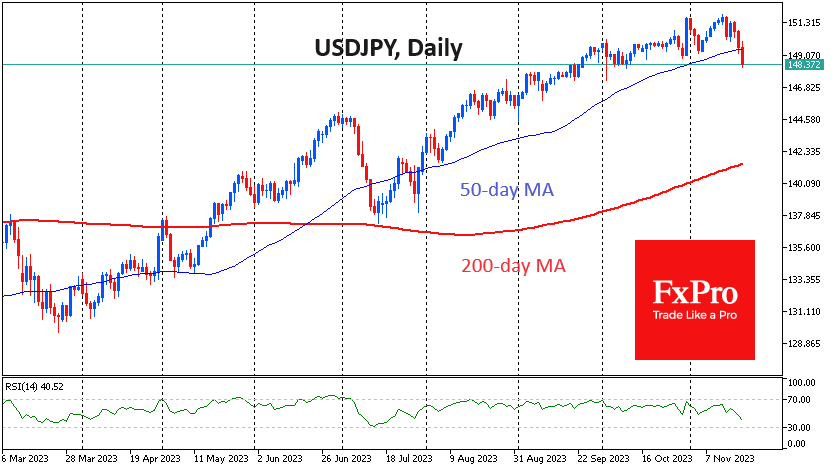
A solid buying base was supported by a weakening Yen, which has lost 4% against the Euro and Pound since 30th October. However, while the Yen has failed to see a meaningful change in the Bank of Japan’s course, USDJPY seems to have fallen under its weight since the end of last week, and its appreciation has prompted equity traders to switch to profit-taking.
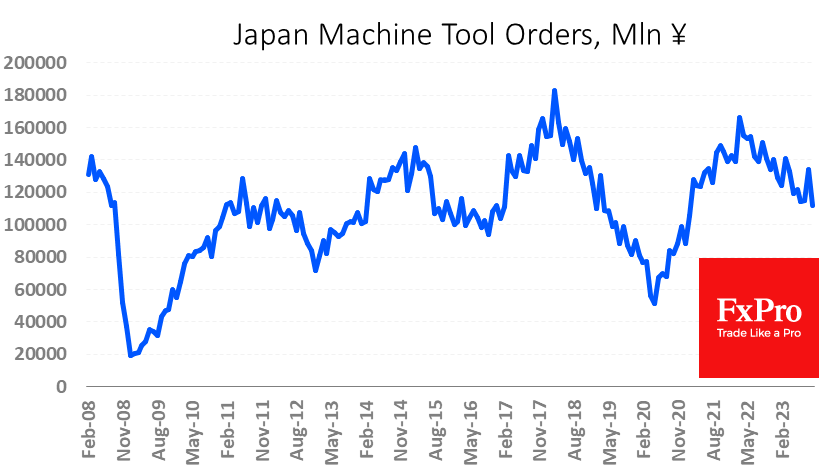
It’s also possible that, despite the yen’s previous weakness, the caution in Japan has come on the back of weak macroeconomic data. Last week, it was reported that Machine Tool Orders fell 20% y/y in October, following a 5.5% y/y decline a year earlier. The weak yen also appears to be hurting the broader economy, as GDP contracted by 0.5% in the third quarter. The economy fails to benefit from a weaker yen while facing rising import costs.
The technical reason for the sell-off in equities was the fresh wave of Yen strength since the morning. The USDJPY shows signs of breaking out of its uptrend as it dips below its 50-day moving average.
The Nikkei 225 has seen a sharp reversal of 1.6% from its intraday high as it hit overbought levels on the RSI. If the stock market declines continue, our attention will turn to the momentum around the 33000 and 32500 levels, which are the 76.4% and 61.8% Fibonacci retracement lines of the 76.4% and 61.8% rally from late October, respectively.
If the Japanese market’s decline does not stop there, the bulls’ last hope is at 32000 (50-day average) and 31000 (200-day average). Failure to break below these will mean a transition to a downtrend.


