
Summary
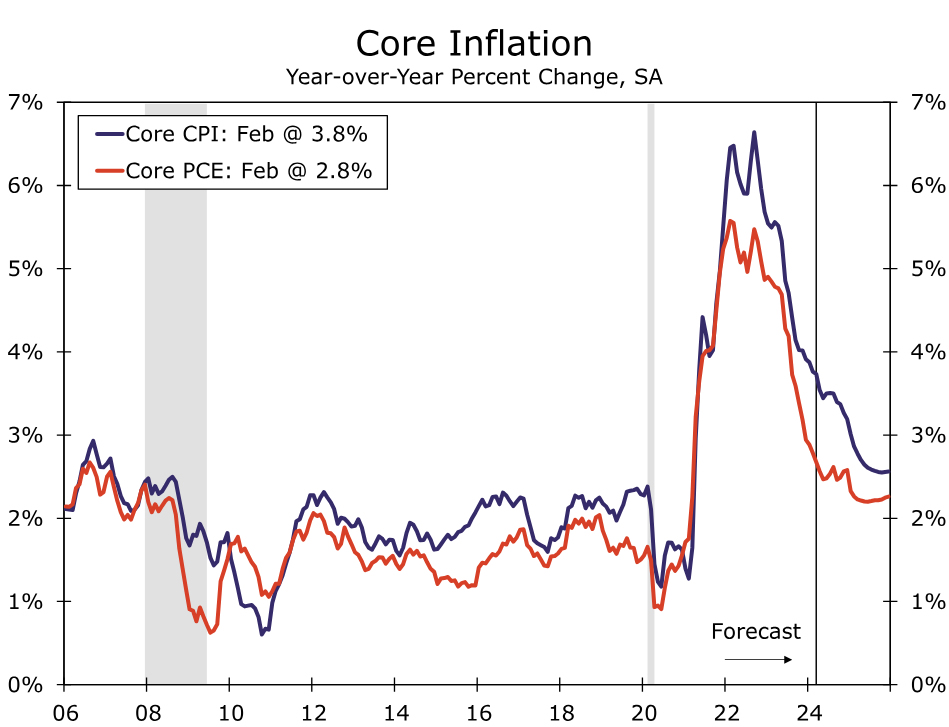
Progress in reining in inflation is further along by some measures relative to others. The gap between the two most prominent measures of U.S. inflation—the Consumer Price Index (CPI) and PCE deflator—is unusually wide at present. At 3.8%, the year-over-year rate of core CPI sits a full percentage point higher than core PCE inflation compared to a historical gap of 0.3 points. In this report, we discuss key differences in the construction and use of CPI and PCE indices, the drivers of the current wedge and what it could mean for the path of interest rates ahead.
- The CPI may be a more familiar measure of inflation than the PCE index given its long history and frequent use in price contracts. However, the FOMC benchmarks its 2% inflation target to the PCE deflator, making it more relevant for the path of monetary policy.
- The CPI and PCE index move closely together over time but can temporarily diverge due to differences in construction. The CPI focuses on consumers’ direct expenditures paid for out-of-pocket. That makes it narrower in scope than the PCE index, which includes the cost of items purchased on behalf of households and purchases furnished without payment. The wider scope of the PCE leads to different category weightings, most notably for healthcare and housing. Different formulas and sources also contribute to the variation in reported price growth.
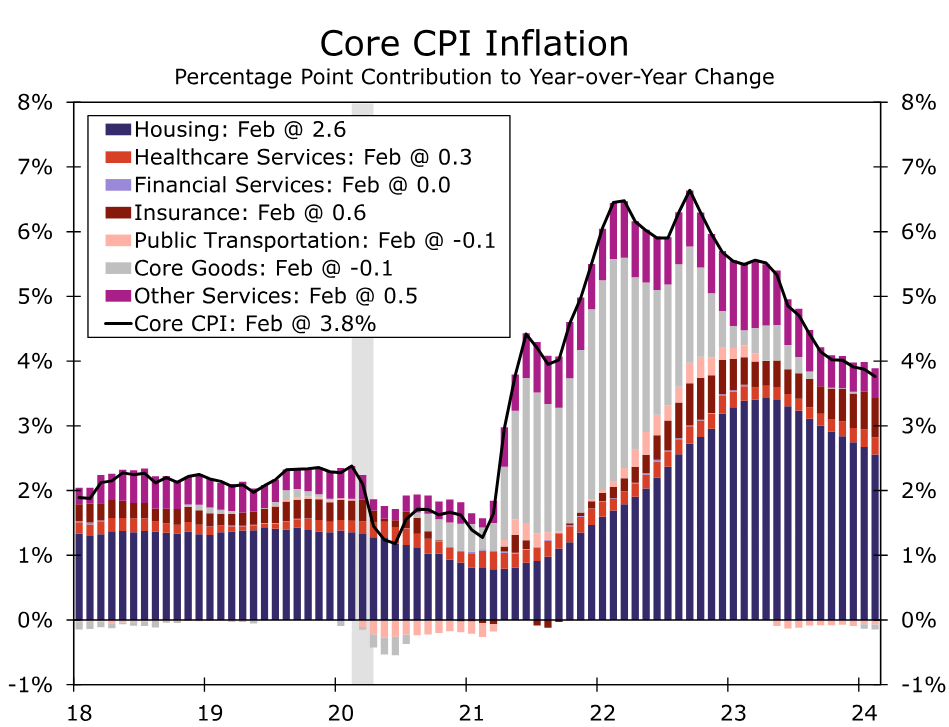
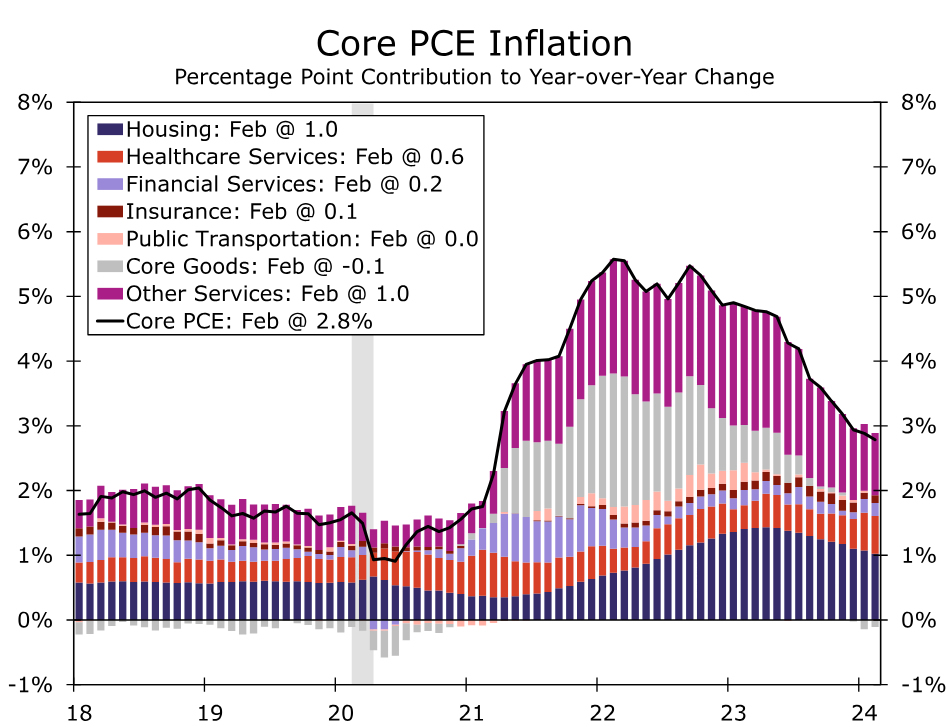
- On a categorical basis, housing has been by far the largest source of the inflation wedge the past year. While primary shelter inflation is up a little less than 6% by both the CPI and PCE index, it carries 2.5x the weight in the core CPI. As a result, primary shelter has contributed 1.5 percentage points more to the year-over-year rate of core CPI than core PCE. Motor vehicle insurance is also providing an unusually large boost to core CPI. In contrast, strength in services categories more heavily weighted in the core PCE index, such as healthcare, or out of scope of the core CPI, such as food services or nonprofit institutions, have helped to narrow the chasm between core CPI and core PCE the past year.
- We anticipate the gap between core CPI and core PCE when measured on a year-ago basis to remain uncharacteristically wide through the first half of 2025. Bringing the gap back down to its historical realm of 0.3 points will hinge heavily on shelter inflation returning near its pre-pandemic pace, which we estimate will occur around next spring. Slower growth in the CPI measure of motor vehicle insurance now that premiums have increased more than vehicles and repair service costs should also help to bring core CPI down closer in line with core PCE.
- We do not believe the inflation wedge is an issue for the FOMC. Fed officials continue to espouse optimism that shelter inflation, the most significant contributor at present, will ease further in the coming months. And although large, the current wedge between core CPI and core PCE is not unprecedented. A similarly sized wedge opened up in the late 1990s and in 2001 and 2009. As the pricing environment cools from its extreme state, the gap should diminish as well.
How Much Has Inflation Improved? Depends on How You Measure It
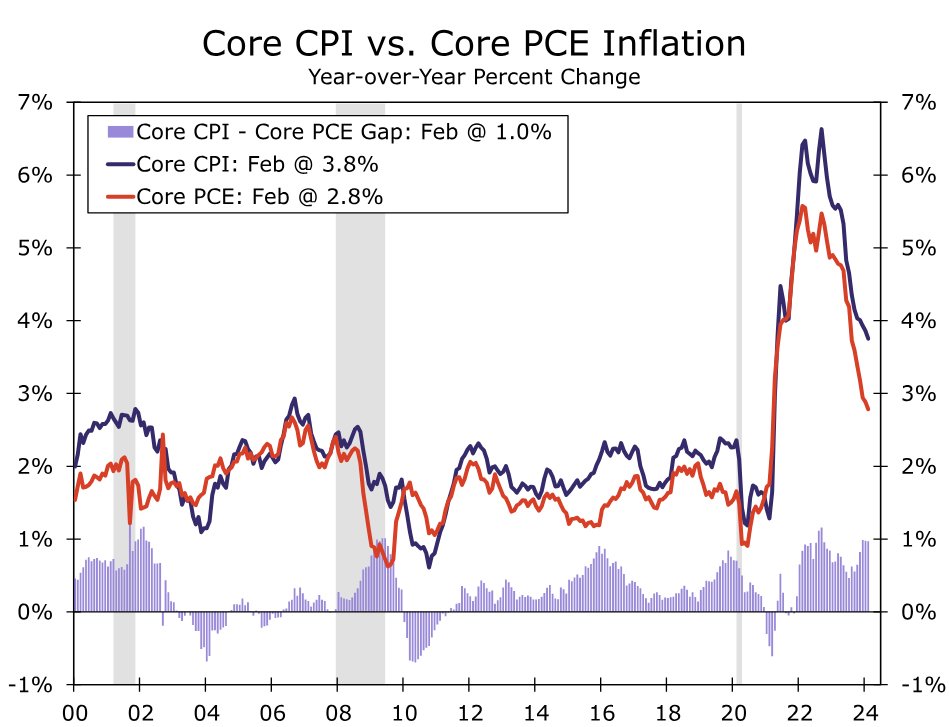
Inflation has fallen sharply since the fever-pitch reached in the summer of 2022. However, progress in fully quieting inflation is further along by some measures relative to others. The Consumer Price Index in the 12 months through February rose 3.2%, a full percentage point faster than its average pace from 2000-2019. Excluding the volatile categories of food and energy, the core CPI has made less progress in settling down, having increased 3.8% year-over-year in February. In comparison, the core PCE deflator has fallen back below 3%. The more marked improvement in PCE inflation over the past year relative to CPI has led to an unusually wide gap between the two most prominent measures of U.S. inflation (Figure 1). Since 2000, the core CPI deflator has run an average of 0.3 percentage points higher than the core PCE deflator, but the gap currently stands at 1.0 percentage point—near the top end of its range in recent decades. What’s driving the wedge, and what could it mean for the path of interest rates and broader economy ahead?
Different Strokes for Different Folks: Uses of the CPI and PCE Deflator
There is no shortage of ways to look at inflation in the U.S. economy. Government agencies publish an array of price indices for goods and services consumed by different end users (e.g., businesses, households and the government), as well as sold by different types of producers (e.g., domestic or foreign). Among the various gauges of inflation, the Consumer Price Index (CPI) and Personal Consumption Expenditure Price Index (PCE deflator) are the most closely watched.
The CPI has a long history of being in the limelight and tends to be the most familiar measure of inflation. The CPI measures price changes for a representative basket of items purchased directly by consumers. Its focus on consumers’ out-of-pocket costs leads it to align more closely with consumers’ perceived inflation experience. The CPI is also widely used in wage contracts and by the government. For example, Social Security’s annual cost of living adjustment (COLA) is based on the CPI while income eligibility for many government programs and federal tax brackets are adjusted with the CPI. Further, the nearly $2 trillion market for Treasury Inflation-Protected Securities (TIPS) adjusts principal returns for inflation using the CPI, tying the CPI directly to a large segment of the financial market.
The PCE deflator also has a key tie to financial markets and the economy writ large: the FOMC benchmarks its 2% inflation target to the PCE deflator. As the preferred inflation gauge of the Fed, the PCE deflator is more relevant for the path of U.S. monetary policy. While over time the CPI and PCE move closely together, unusually wide divergences, like that of today, may send different messages about price pressures in the economy and what may lie ahead for the setting of interest rates.
Why the Fed’s a Fan of PCE Inflation
The Fed’s preference for the PCE deflator can be chalked up to two primary attributes. First, it is wider in scope than the CPI and as a result, generates a more encompassing picture of inflation in the U.S. economy. Whereas the CPI measures the change in out-of-pocket costs to consumers, the PCE price index includes the cost of items purchased on behalf of households, such as medical care paid for by the government or employer-sponsored health insurance. The PCE deflator also incorporates implicit prices of items not directly purchased on the market or “furnished without payment.” Examples include the cost of financial services like “free” checking accounts, brokerage fees, or nonprofit services.
Notably, the wider scope of the PCE can lead to significant differences in categorical weightings. Items not purchased directly by consumers or items that are also purchased on behalf of households carry a bigger weight in the PCE (e.g., financial services and medical care). In contrast, goods and services purchased directly by consumers bear a higher weight in the CPI (e.g., gasoline, vehicles and shelter).
Second, the PCE deflator and CPI are constructed using different statistical formulas. The PCE formula better accounts for the tendency of consumers to substitute away from products whose prices rise relatively quickly. A common example of this dynamic is if the price of beef is rising more quickly than chicken, consumers will substitute chicken for beef. This substitution effect leads to overall living costs rising more slowly than if measured by the fixed consumption basket in the CPI. As a result, policymakers view the PCE deflator as a more accurate barometer of the overall change in the economy’s price level. The CPI “basket” is updated annually based on the Consumer Expenditure Survey to account for shifts in consumption, and the relative importance of CPI categories adjust monthly based on comparative price changes; however, the PCE method captures substitution effects more quickly by leveraging the expenditure data available for the same period. This “formula effect” leads to the CPI typically running higher than the PCE deflator.
Gap Accounting
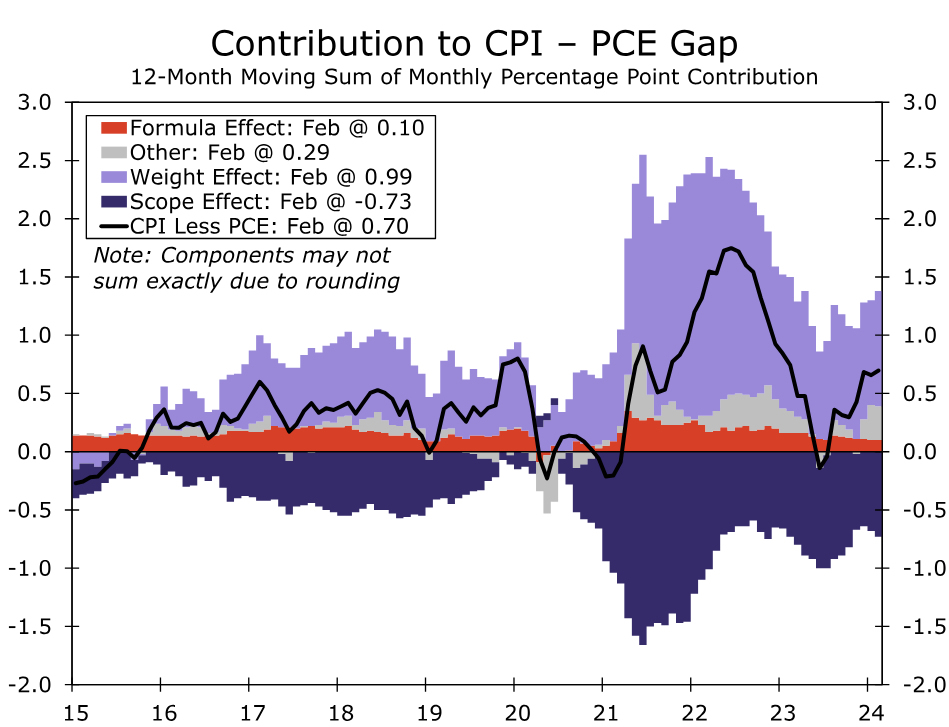
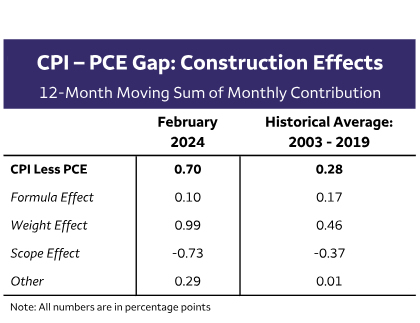
The unique scope, weighting and formulas of the CPI and PCE all influence the gap between the two inflation measures. The formula effect tends to be a persistent, but relatively small and stable source of the wedge (Figure 2). Over the past year, the formula difference has contributed 0.1 percentage point to the 0.7 point gap between the year-over-year rates of CPI and PCE inflation, fairly similar to its average since 2003 (Figure 3). Weighting has played by far the largest role in keeping the CPI running hotter than the PCE the past year, primarily due to the ongoing strength in shelter inflation. Other differences, such as seasonal adjustment or source of pricing data, historically have had little bearing on the gap, but over the past year have been another meaningful contributor (+0.3 points) to the wedge between CPI and PCE. The broader scope of the PCE deflator, in contrast, has helped to narrow the gap with CPI inflation over the past year by a historically large degree.
To help think about how the gap between the CPI and PCE deflator will evolve, we find it useful to also look at it on a categorical basis. We focus on the core indices given FOMC officials place greater emphasis on price growth excluding food and gas when considering the near-term outlook for interest rates.
Housing and Motor Vehicle Insurance Driving Historically Wide Wedge
As shown in Figures 4 and 5, housing more than accounts for the 1.0 percentage point gap between core CPI and core PCE the past year. The PCE uses the CPI’s primary rent and owners’ equivalent rent measures as source data, so housing’s more sizable contribution to core CPI boils down entirely to its larger weight (43% versus 18% in the core PCE index).
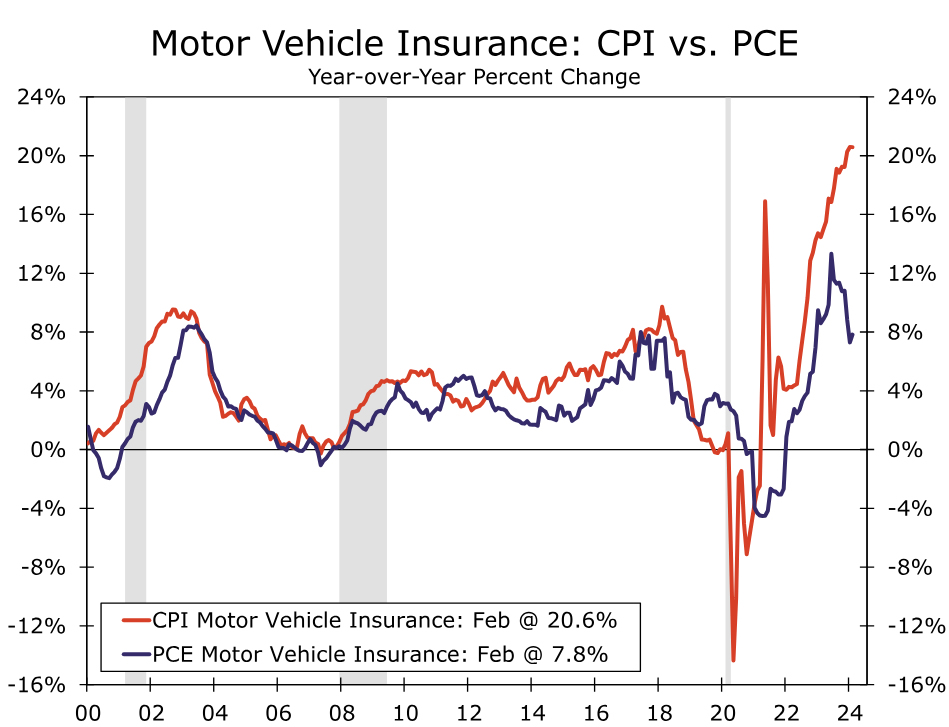
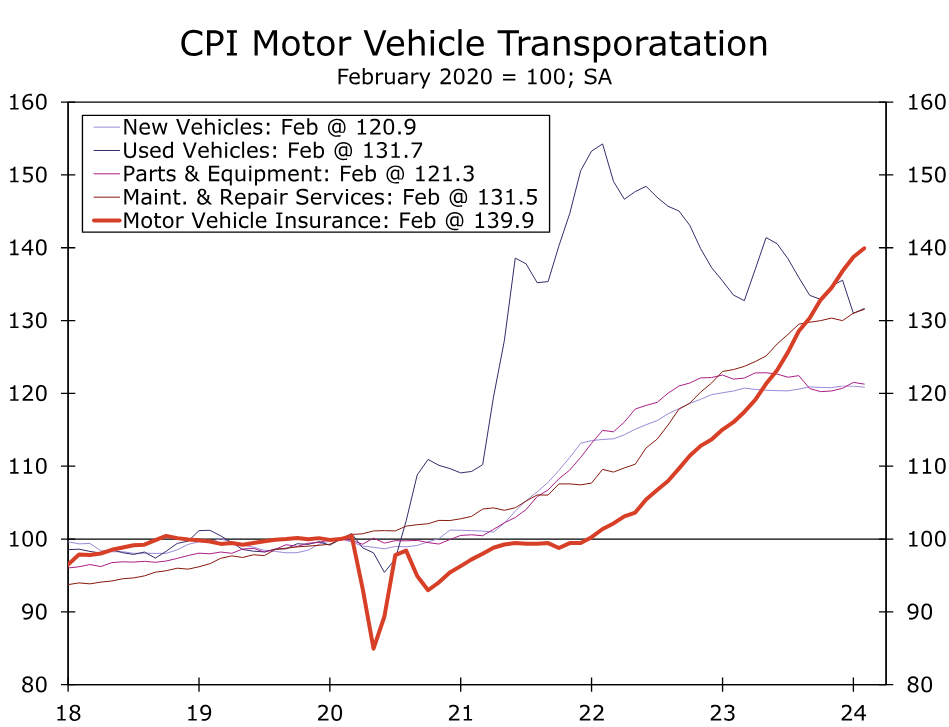
Rapidly rising costs for motor vehicles have also contributed to the relatively hotter rate of core CPI inflation recently. Motor vehicle insurance carries nearly four times the weight in the core CPI (3.5% versus 0.7% in PCE). In the CPI, insurance costs reflect the premiums paid by consumers, but not claims paid out by insurers on behalf of motorists. The PCE’s net-revenue approach has contributed to motor vehicle insurance costs rising less dramatically since insurers’ costs to cover claims have risen rapidly alongside higher vehicle repair and replacement costs (Figure 6). This pricing difference (part of the “other” category in Figure 5) in conjunction with a lower weighting, has led motor vehicle insurance over the past year to add less than 0.1 points to core PCE, compared to 0.7 points to the core CPI. Health and home insurance are also measured differently in the CPI and PCE but, in contrast to motor vehicle insurance, have narrowed the core CPI–PCE gap by a tenth over the past year.
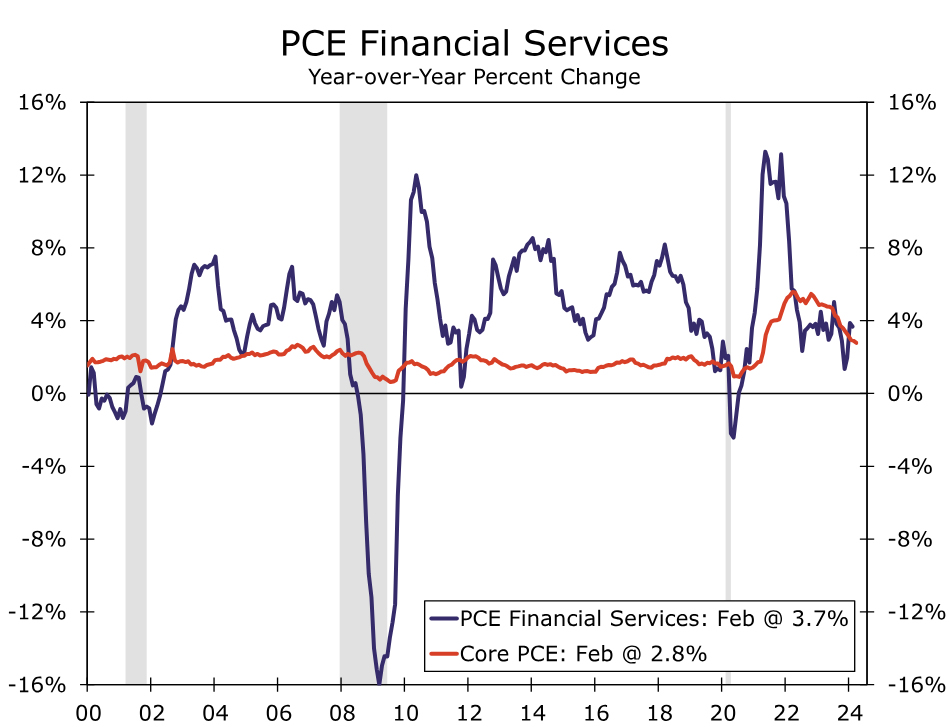
Further, financial services usually narrows the wedge between the two inflation measures, but recently this category has limited the wedge by less than normal. Financial services account for more than 5% of the core PCE deflator, compared to just a few tenths in the CPI as the cost of many financial service products are not paid for out of pocket. Over the past year, the PCE index for financial services has outpaced the broader core PCE, but by a smaller degree than exhibited over the past decade (Figure 7). Accordingly, it has provided less of a leg-up to PCE inflation than usual.
Healthcare and Other Services Limiting A Blowout
Healthcare services costs (ex-insurance) have grown more quickly in the CPI than in the PCE index over the past year. However, the PCE’s greater weighting nevertheless leaves healthcare providing a bigger lift to the year-over-year rate of core PCE inflation, and thus has helped to narrow the current gap with the CPI. Healthcare services historically have contributed 0.1 point more to the year-over-year rate of core PCE than core CPI, but over the past year have added 0.2 points more.
Different methods for measuring airline fares, the lion’s share of public transportation, also have whittled down the gap in core CPI and core PCE. The CPI sample consists largely of discount fares for non-business travel scheduled for either the same month or a month or two out. The corresponding PCE index uses Producer Price Index data for domestic airfare, which measures the change in average revenue per passenger (including business travelers) for flights departing during the reference month. Airfares as measured by the CPI are down just over 6% year-over-year, but are essentially flat per the PCE deflator.
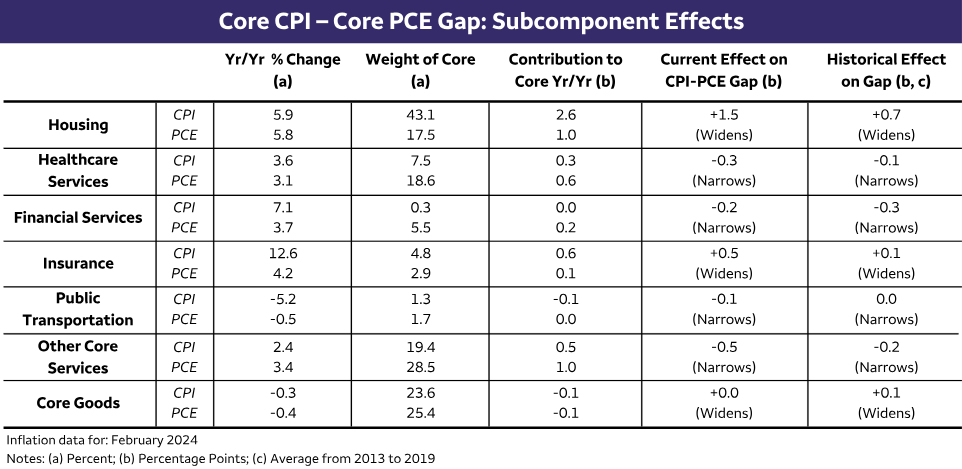
Finally, an array of other services have offered a significant counterbalance to the wedge that shelter and motor vehicle insurance have driven between the core CPI and core PCE. These include categories out of scope of the CPI, like social services or nonprofit institutions serving households, both of which are running higher than the broader core PCE and effectively bringing it more in line with the core CPI. Core PCE inflation also includes food services, which is up 4.4% over the past year and is included in the headline CPI but excluded from the core CPI. A summary of the differences in current category contributions versus their historical effects on the core CPI–PCE gap is shown in Figure 8.
When the Dust Settles
Looking ahead, we expect the gap between core CPI and core PCE when measured on a year-ago basis to remain uncharacteristically wide through the first half of next year (Figure 9). On a quarterly annualized basis, the return to the ~0.3% realm should occur somewhat earlier; we estimate around the first quarter of 2025.
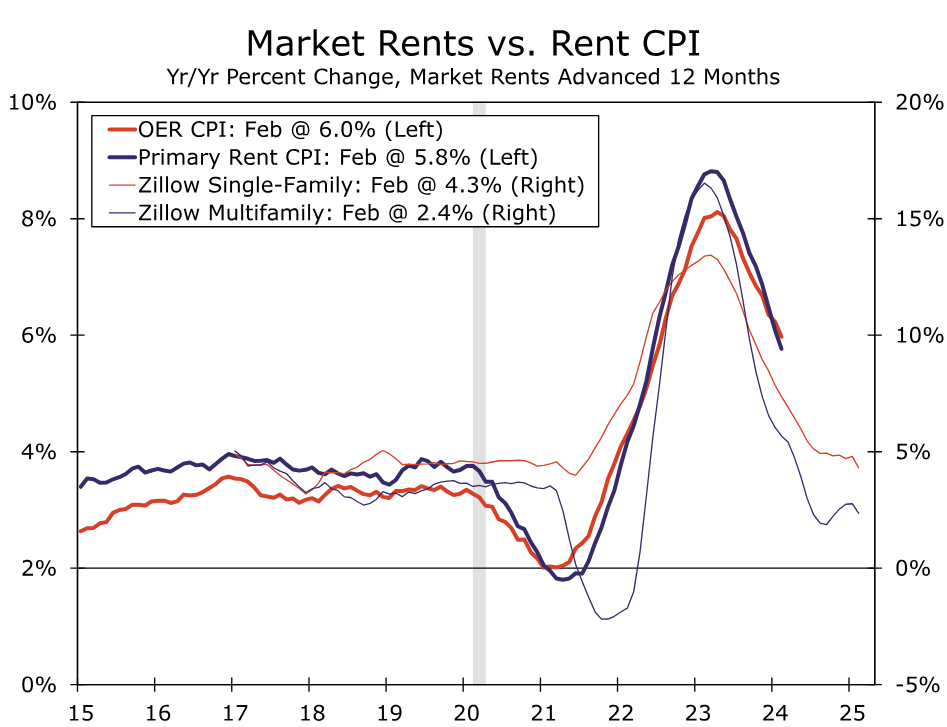
The timing and extent to which the gap between core CPI and core PCE settles back down hinges heavily on the path of shelter inflation given its current hefty contribution. While the moderation in official measures of shelter inflation has been painstakingly slow to materialize, we expect housing disinflation to continue this year with the year-over-year pace of primary shelter resembling its pre-pandemic pace of 3.0-3.5% by next spring. A host of private sector measures suggest apartment rent growth has already settled down, with rents for single family units having also slowed materially (Figure 10). That said, primary shelter has grown to account for an even larger share of CPI since 2019 (+2.5 pts), while the PCE share is little changed. As such, weighting effects are likely to continue to play somewhat of a bigger role on the CPI–PCE gap unless shelter inflation undershoots broader core inflation, an outcome that is plausible but unlikely in our view.
We also anticipate that the chasm stemming from motor vehicle insurance will narrow over the course of the year. Insurers have had to play catch-up to the spike in vehicle and repair costs following severe supply shortages in the auto industry, a process drawn out by the need for regulatory approval to raise premiums in most states. However, motor vehicle insurance premiums per the CPI have now risen more than the price of vehicles, equipment and repair services since the start of 2020, suggesting a diminishing need for premiums to continue rising at the past years’ eye-watering pace (Figure 11). Recent months’ data show tentative signs of the CPI for motor vehicle insurance already beginning to cool, with prices up 17% on a three-month annualized basis compared to 21% on a 12-month basis.
The expected narrowing of the inflation gap as shelter and motor vehicle insurance inflation slows is likely to be partially offset, however, by cooler price growth in categories currently providing an unusually-large boost to core PCE. As inflation pressures ease from more tepid demand and a balanced labor market, we expect slower price growth for healthcare, food services and other sundry services to reduce the outsized contribution “other core services” are currently providing to core PCE. Public transportation is also unlikely to reduce the inflation gap ahead as the CPI for airfares recovers from last summer’s swoon.
Monetary Policy Implications: The Fed’s Not Sweating the Gap
The relatively higher rate of CPI compared to the PCE deflator likely goes some way in explaining why consumers continue to reel from the current inflation environment, but Fed officials see enough progress to expect some policy easing later this year. Even as consumer sentiment has improved over the past year, it remains low relative to the strength of the jobs market as prices paid by consumers continue to rise at an unfamiliar speed.
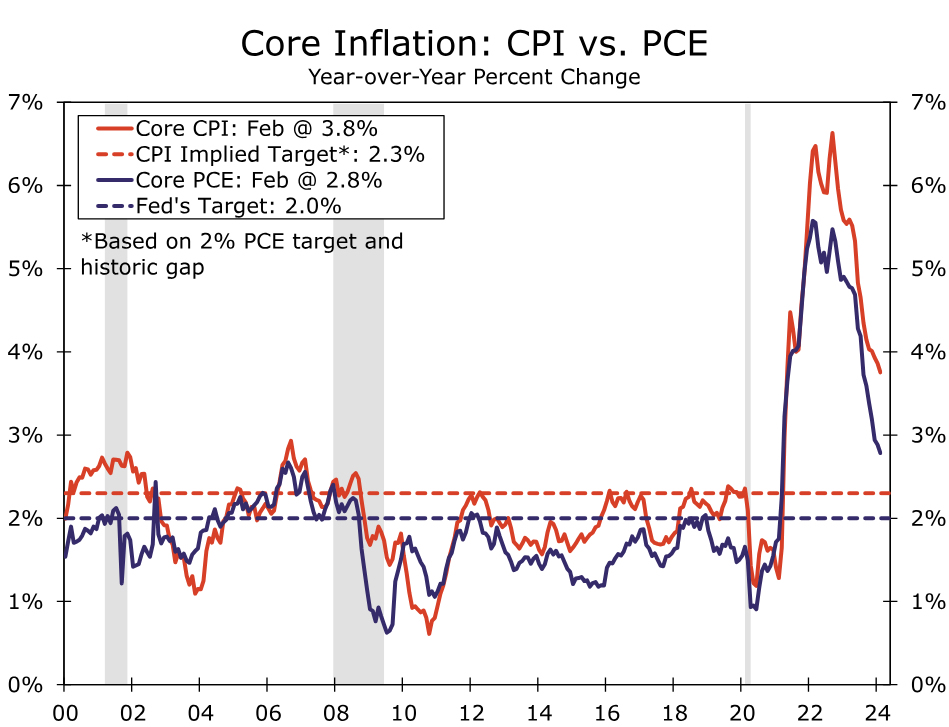
Yet, while core inflation as measured by both the CPI and PCE price indexes remains too high, it has fallen more sharply over the past year when measured by the PCE deflator and is closer to the pace consistent with the Fed’s inflation target (Figure 12). Furthermore, although the gap currently remains large, it is not unprecedented. A similarly sized wedge opened up in the late 1990s and in 2001 and 2009. As the pricing environment cools from its extreme state, the gap should diminish as well.
We doubt the Fed is too bothered by the CPI–PCE gap. The elevated rate of shelter inflation is the largest contributor to the wedge at present, but officials continue to espouse optimism that shelter inflation will ease further ahead. In the March 20 FOMC press conference, Chair Powell said that “There’s a little bit of uncertainty about when that will happen but there’s real confidence that [lower market rents] will show up eventually over time.”
While the wedge between CPI and PCE inflation does not appear to be a major source of consternation among Fed officials, it could make the FOMC’s job of returning PCE inflation to 2% a little harder on the margin with cost of living adjustments and price contracts more likely to be based off of the stronger CPI inflation rate. In addition, the Fed does not solely look at the PCE deflator when assessing the current state of inflation. If the gap persists at recent levels and the drivers shift away from housing, it could contribute to some unease among policymakers about the risk of cutting the fed funds rate too early.
Nevertheless, we do not believe the current gap between the two most ubiquitous measures of U.S. inflation is causing any particular misgivings among the FOMC participants about the path of inflation ahead. With the Fed’s preferred inflation measure continuing to grind lower, some easing of policy this year likely remains in the cards.


 and PCE deflator—is unusually wide at present. At 3.8%, the year-over-year rate of core CPI sits a full percentage point higher than core PCE inflation compared to a historical gap of 0.3 points. In this report, we discuss key differences in the construction and use of CPI and PCE indices, the drivers of the current wedge and what it could mean for the path of interest rates ahead.)