
 and output has ramped up since then, the risk of stagflation in the coming year or so remains elevated. In this first report of a three-part series, we present a framework to characterize historical episodes of stagflation into mild, moderate or severe episodes.)
Part I: A Framework to Characterize Episodes of Stagflation
Summary
- In this first report of a three-part series, we present a framework to characterize historical episodes of stagflation into mild, moderate or severe episodes.
- Iain Macleod coined the term “stagflation” during an address to the House of Commons in 1965: “We now have the worst of both worlds—not just inflation on the one side or stagnation on the other, but both of them together.”
- Stagflation can impose significant stress on the economy and can be a difficult situation to escape. Elevated inflation erodes consumer purchasing power, while weaker demand leads to a deterioration in the labor market, thereby limiting the opportunity for real wage gains.
- Conventional monetary or fiscal policy actions are remedies that often improve stagnation or inflation, but not both.
- The most salient episode of stagflation in modern U.S. history occurred in the 1970s. A perfect storm of energy price shocks, robust labor cost growth and elevated government spending led inflation to spiral, while economic output faltered and unemployment rose.
- While we could debate on the fairness of that comparison, the exercise of comparing bouts of stagflation led us to develop a simple framework to organize historical episodes on a severity scale.
- In data that span 1950 to present, we identified 13 instances of stagflation. Five episodes are mild, four are moderate and four are severe. The shortest episodes lasted two quarters, occurring in 1977-1978 and 1995, and the longest episode occurred in 1979-1982 (16 quarters).
- In the next installment of this series, we summarize past episodes of stagflation and their accompanying monetary policy decisions.
A Stagflation Situation
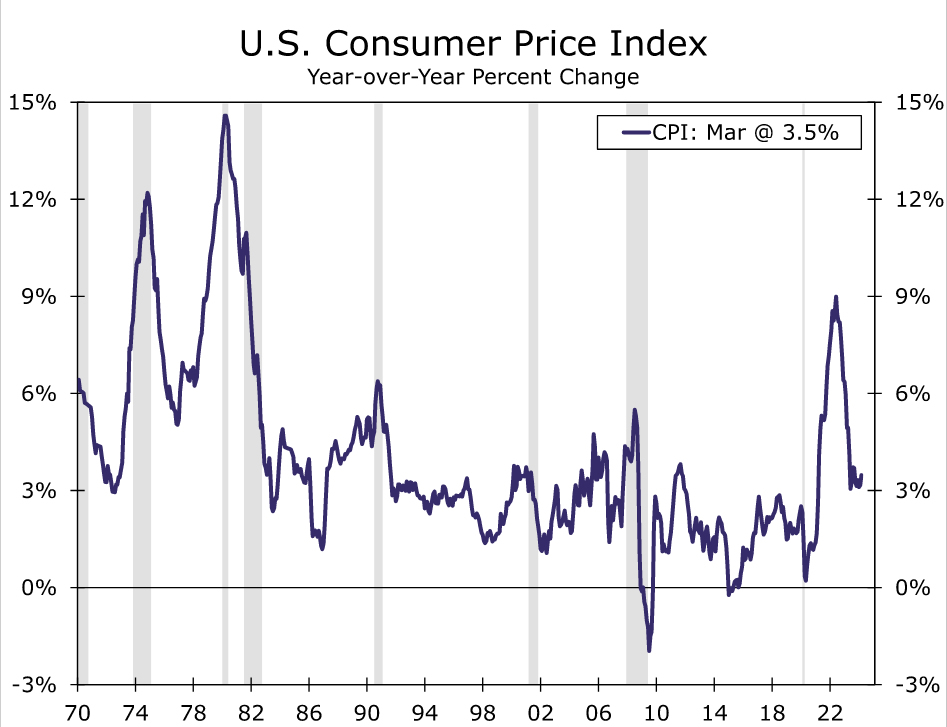
The door to stagflation has opened. Consumer price inflation ripped to a 40-year high in 2022 while real GDP growth was negative through the first half of that year. Persistent price growth amid contracting output can spell trouble for the stability of the economy. While inflation has cooled (Figure 1) and output has ramped up since then, the risk of stagflation in the coming year or so remains elevated. In this first report of a three-part series, we present a framework to characterize historical episodes of stagflation into mild, moderate or severe episodes.
To the best of our knowledge, Iain Macleod coined the term during an address to the House of Commons in 1965. He said, “We now have the worst of both worlds—not just inflation on the one side or stagnation on the other, but both of them together. We have a sort of ‘stagflation’ situation. And history, in modern terms, is indeed being made.”
Macleod believed history was being made because the economic literature at the time doubted the existence of stagflation. Stagnation and inflation often move in opposite directions. The Phillips Curve is predicated on a similar principle. That is, a rising unemployment rate, which typically correlates with falling output, will bring down inflation; a falling unemployment rate, which typically correlates with rising output, will push inflation higher. The occurrence of stagflation ran in opposition to the logic behind the Phillips Curve, as elevated price growth persisted amid rising unemployment and weak economic growth.
Stagflation can impose significant stress on the economy and can be a difficult situation to escape. Elevated inflation erodes consumer purchasing power, while weaker demand leads to a deterioration in the labor market, thereby limiting the opportunity for real wage gains. Conventional monetary or fiscal policy actions are remedies that often improve stagnation or inflation, but not both. For example, enacting an expansionary policy, such as a fiscal stimulus package for consumers, can promote economic activity during a downturn, but it can also cause inflation to rise, all else equal. On the flip side, enacting a contractionary policy, such as raising short-term interest rates, can help to rein in inflation, but higher rates also dampen economic growth prospects.
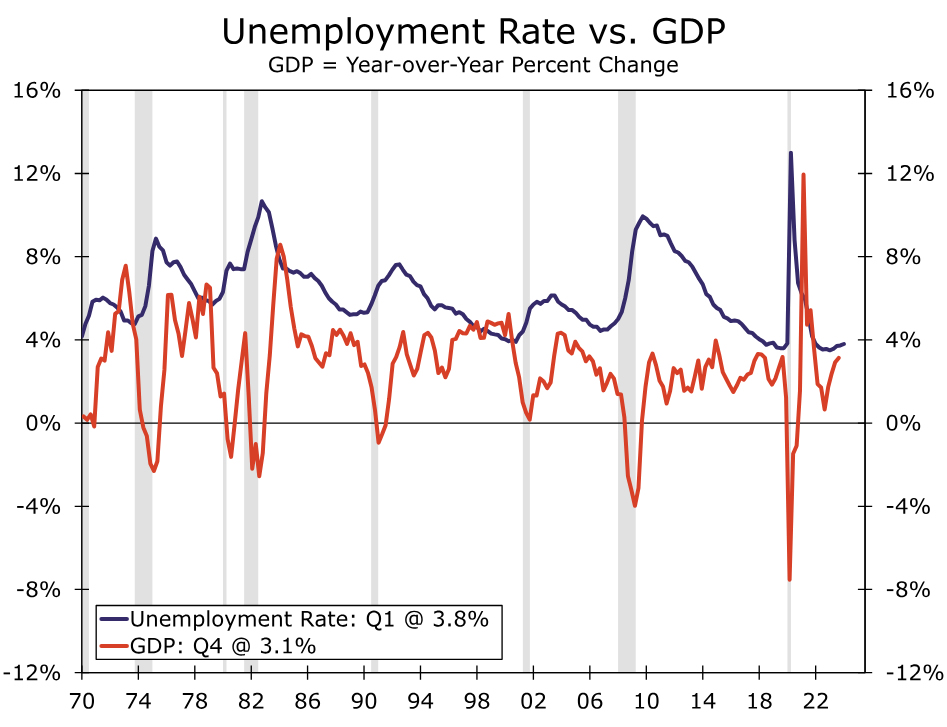
The most salient episode of stagflation in modern U.S. history occurred in the 1970s. A perfect storm of energy price shocks, robust labor cost growth and elevated government spending led inflation to spiral while economic output faltered and unemployment rose (Figure 2). At the time, the appropriate monetary policy path was not readily apparent and the Federal Reserve, led by Chair Arthur Burns, lowered the target for the federal funds rate in the mid-1970s to support employment growth. Yet expansionary policy during a stagflationary episode turned out to be a policy mistake. While the unemployment rate descended over the back half of the 1970s, consumer prices continued to increase at a rapid clip as elevated petroleum prices and wage costs were passed on to households via higher selling prices. Price stability was eventually restored in the 1980s after a few tough years of restrictive monetary policy enacted under Chair Paul Volcker.
Analysts have pointed to the 1970s as a similar experience to the post-pandemic inflation surge. While we could debate on the fairness of that comparison, the exercise of comparing bouts of stagflation led us to develop a simple framework to organize historical episodes on a severity scale.
Laying the Foundation
We define a stagflation episode as a period of at least two consecutive quarters with elevated inflation and low output growth. We use the year-over-year percent change of the CPI as our measure of inflation, and the compound annual growth rate of real GDP as our measure of output growth. We readily acknowledge that the FOMC’s current preferred measure of inflation is the PCE deflator.1 However, the FOMC formerly used the CPI as its primary inflation gauge and forecasted the CPI in the Greenbook until 2000. (The Greenbook forecasts switched to the PCE deflator in 2001). Still today, the FOMC pays close attention to the CPI, as it is timelier than the PCE deflator.
Figure 3 shows average real GDP and CPI growth for each business cycle expansion since 1950 and their standard deviations. The greatest average real GDP growth of 7.75% followed the 1948-1949 recession, while the smallest average growth of 2.31% reflects the post-Great Recession era. If we used 7.8% as a benchmark for real GDP growth throughout our entire sample, then most of the GDP series would be below average. By the same token, using 2.3% as the benchmark for output growth would render most periods as above average. Consequently, we employ the prior cycle’s average of real GDP growth as a benchmark to determine periods of “low” output growth.
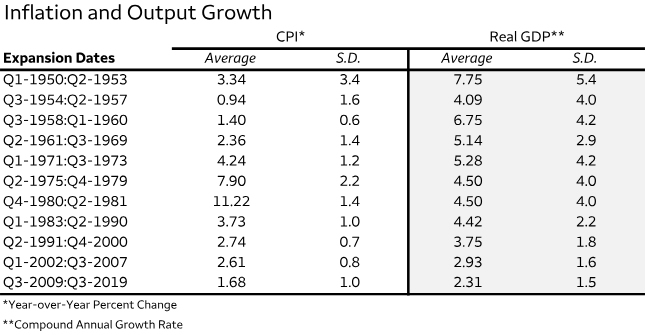
If real GDP growth comes in below the prior cycle’s average for at least two consecutive quarters, we assign that period with low output growth. For example, real GDP growth averaged 2.9% between Q1-2002 and Q3-2007. In the expansionary phase following the Great Recession in 2007-2009, the U.S. economy expanded at rates below 2.9% from Q4-2010 through Q3-2011, so we designate this period with low output growth.
On the inflation side, our benchmarks are more fluid. The evolving nature of the U.S. economy has made one period’s high inflation feel too high of a bar to clear for other periods. For instance, the CPI averaged 7% annual growth throughout the 1970s, compared to its 1990s average of 3%. Several structural changes took place between these two decades, such as a transition away from price indexation in wage contracts and less reliance on petroleum imports. Thus, we employ a time-varying benchmark for inflation and summarize them in Figure 4.
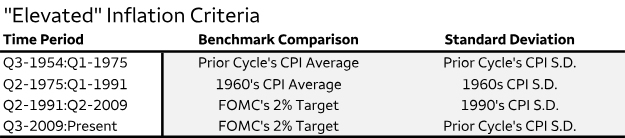
We find that the 2% target is a reasonable benchmark for the 1990s onwards, as inflation trended around that rate and monetary policy decisions were guided by that target. Indeed, the FOMC started to explicitly publish its 2% inflation target in post-meeting statements in the early 1990s. Prior to 1990, the inflation picture was mixed. Inflation was elevated and volatile during the 1970s and 1980s (revisit Figure 3). To parse through the variation, we use the CPI’s average growth over the expansionary phase of the 1960s (2.36%) as the watermark for “normal inflation” from 1975 to 1991. Prior to 1975, we return to using the prior cycle’s average CPI growth as the benchmark.
Drawing Lines in the Sand
We utilize the magnitude and duration of high inflation, alongside low output growth, to characterize stagflation into different categories. If a period is determined to have low output growth relative to the prior cycle, we then evaluate the inflationary pulse of that period to determine if stagflation occurred. Should inflation be elevated relative to the criteria outlined in Figure 4, we then categorize the episode of stagflation as mild, moderate or severe.
Given real GDP growth is below the prior cycle’s average for at least two straight quarters, we define a “mild” episode of stagflation as two consecutive quarters where the CPI inflation rate is above the inflation benchmark by one standard deviation. A “moderate” episode is three or four consecutive quarters where CPI inflation is above the benchmark by one to three standard deviations. Finally, a “severe” episode is at least six consecutive quarters where the CPI inflation rate is above the benchmark by three standard deviations or more.
In data that span from 1950 to present, we identified 13 instances of stagflation and outline them in Figure 5. Five episodes are mild, four are moderate and four are severe. The shortest episodes lasted two quarters, occurring in 1977-1978 and 1995, and the longest episode occurred in 1979-1982 (16 quarters). Furthermore, four stagflation episodes did not overlap with recessions, while nine episodes occurred during or near a recession.
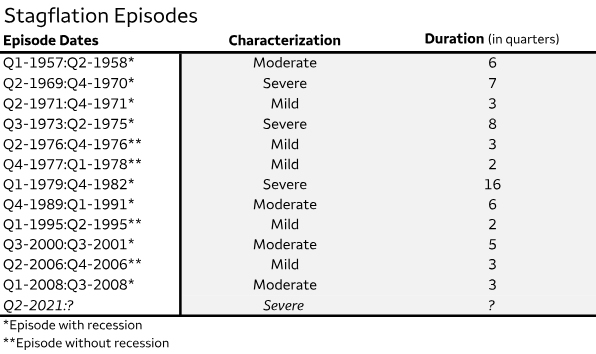
The most recent occurrence of stagflation began in the second quarter of 2021, when consumer prices gathered momentum amid gummed up supply chains and ramped up household demand. The drivers of inflation have shifted as we have gotten further away from the pandemic, but price growth remains persistent, especially relative to the past business cycle. At the same time, output growth has strengthened, which suggests the severity of the latest bout of stagflation has eased or the episode has ended altogether.
What will U.S. central bankers decide in the face of these crosscurrents? Can we learn from historical episodes of stagflation? In the next installment of this series, we summarize past episodes and their accompanying monetary policy decisions. In the final installment, we revisit the 2021 episode and consider the risks of stagflation in the coming years.2
Endnotes
1 – See a recent special report published in April 2024 for more detail on the differences between the Consumer Price Index and the PCE Deflator.
2 – This series is based on a 2024 American Economic Association Annual Meeting paper by Azhar Iqbal and Nicole Cervi titled “Characterizing Stagflation into Mild, Moderate and Severe Episodes: A New Approach”. Please contact the authors if interested in the full paper.