Canadian Highlights
- Capital spending intentions for 2026 flagged a pick-up in nominal private sector investment, alongside continued growth in the public sector.
- Canadian GDP contracted 0.6% annualized in the fourth quarter, thanks to an inventory draw down. Beneath the headline, domestic demand and net trade were much healthier.
- The solid details of the GDP report likely left the Bank of Canada comfortable with its current on-hold stance.
U.S. Highlights
- President Trump focused on tariffs and cost of living issues in his State of the Union Address.
- Consumer confidence edged higher in February on improved expectations, but views of current conditions weakened further as labor market pessimism persisted.
- Mortgage rates fell below 6% for the first time in over three years, offering modest support to the housing market.
Canada – Weak Q4 Headline GDP Number Masks Solid Domestic Demand
Financial markets were hit with a bevy of crosscurrents this week. In the bond market, Canadian yields declined alongside U.S. yields, as ongoing tariff uncertainty encouraged investors to seek the relative safety of U.S. bonds. Oil prices were volatile, affected by fluctuating perceptions of U.S.-Iran tensions as negotiators from both countries met. Oil was up for the month overall, which will upwardly pressure Canadian CPI inflation in February. Equity markets, meanwhile, were higher again this week, supported by bank earnings and commodity prices.
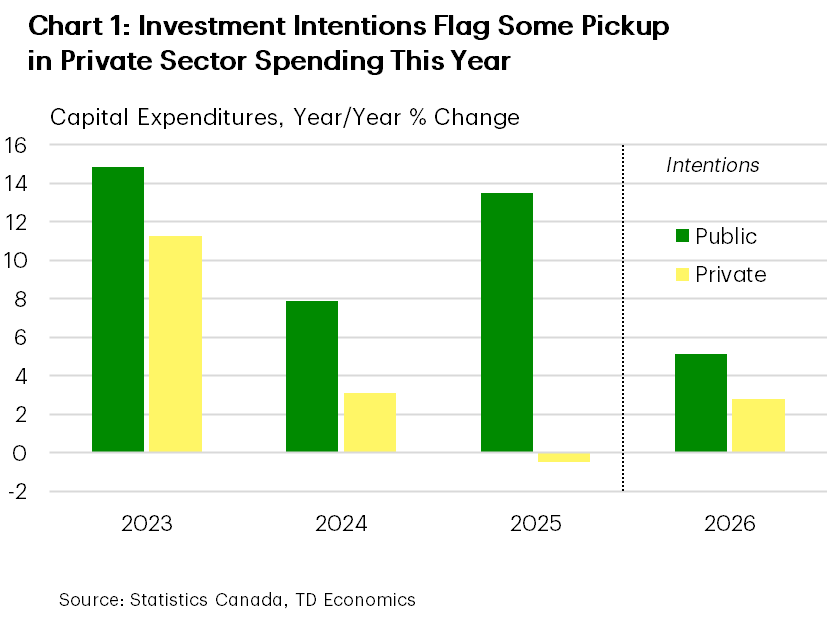
Data flow was mixed this week. Given the importance of business investment in forecasts for Canadian economic growth, we were eagerly anticipating this week’s release of the survey of capital spending for 2026. Last year, nominal non-residential spending on structures and machinery and equpiment increased about 5%. Economic uncertainty led to a pullback in private sector investment, although the public sector increased its investment spending significantly. Investment intentions for 2026 in the survey flagged another outperformance by the public sector. However, the picture is a bit brighter compared to last year for the private sector, where nominal investment is slated to advance 3% (Chart 1).
This week’s Survey of Employment, Payrolls and Hours offered a pulse-check on the jobs market in December. The report sent a much weaker signal than the earlier-released LFS jobs data, as payroll hiring was off 0.2% in the month while hours worked sagged.
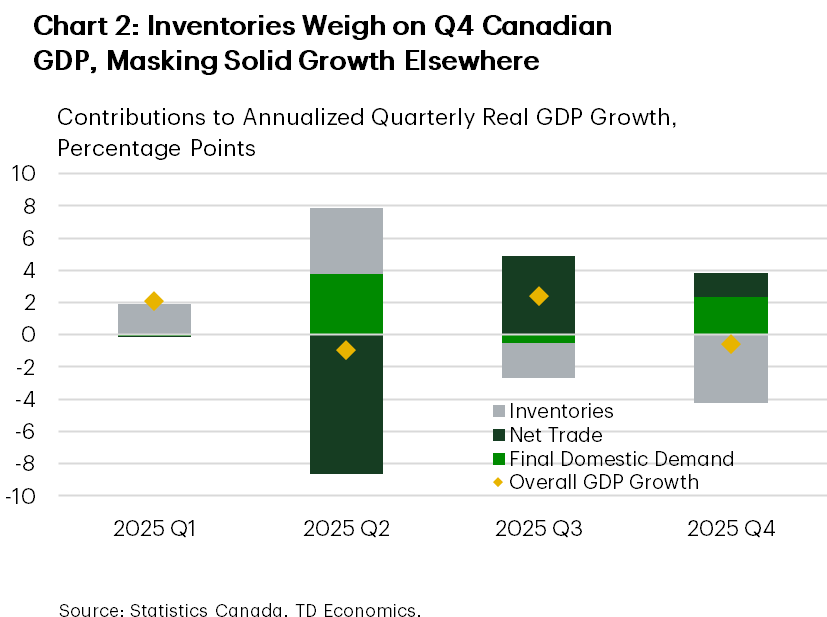
While these reports gave important signals on the economy, the marquee event this week was this morning’s release of Q4 Canadian GDP. Real GDP contracted by 0.6% annualized in Q4. The knee-jerk reaction of markets was to shift the odds slightly more towards a rate cut this year (though they’re assigning less than a 50% chance of one this year) on the headline number. But, peeling back the layers showed a better performance (Chart 2). For starters, inventories were the main growth drag, as final domestic demand was up a sturdy 2.4% annualized (stronger than our expectation) boosted by consumption growth and government spending. There was also a partial bounce-back in non-residential investment, consistent with the tone of the capital intentions survey. Net trade also contributed positively, driven by a solid gain in exports. Even the monthly, industry-based GDP for December was stronger than Statcan had previously guided.
If there was one blemish in the GDP report it was that output may have moderated in January, though even here, winter storms may have had a hand. Overall Canada’s economy felt the impact of U.S. tariffs in 2025. GDP growth slowed from 2% in 2024 to 1.7%, with Statistics Canada pointing out the slowdown was mainly due to weaker exports to the United States.
For the Bank of Canada, there was likely enough in the GDP report to leave them comfortable in their current hold stance, despite the weak headline figure.
U.S. – The State of the Union and the State of the Economy
This week’s economic calendar was light, with highlights including a modest rise in consumer confidence, a drop in mortgage rates, the State of the Union Address (SOTU), and ongoing trade policy uncertainty. In his SOTU, President Trump reaffirmed support for tariffs as a government revenue tool. The U.S. has imposed 10% duties on imports from all countries for 150 days under Section 122, pivoting quickly after last week’s Supreme Court decision striking down the administration’s use of tariffs under the International Emergency Economic Powers Act (IEEPA). The President subsequently threatened to raise the 10% blanket tariff to 15%, but no executive order has been signed.
Questions also remain about whether the $133 billion in IEEPA revenues—60% of total U.S. tariff revenue in 2025—will need to be refunded. The Court did not decide on this, so further litigation is likely. The potential revenue loss could push U.S. Treasury yields higher, as tariff revenue was expected to offset much of the One Big Beautiful Bill Act’s cost. However, markets appear unconcerned, either expecting the administration to find other ways to secure tariff funds or anticipating a lengthy litigation process. So far only a small fraction of importers has filed lawsuits for refunds.
Cost-of-living concerns were also addressed in the speech. The president noted that prices for some key goods have moderated, even as prices broadly continued to rise. He urged Congress to address healthcare costs and highlighted efforts to lower prescription drug prices. Housing affordability was mentioned, with a renewed call to restrict large institutional ownership of single-family homes. On that note, mortgage rates continued to ease this week. The average 30-year fixed rate fell to 5.98% on Thursday—the first sub-6% reading in over three years. Lower rates and a steady labor market should help boost home sales, but without broader affordability and supply improvements, a major turnaround in the housing market is unlikely.
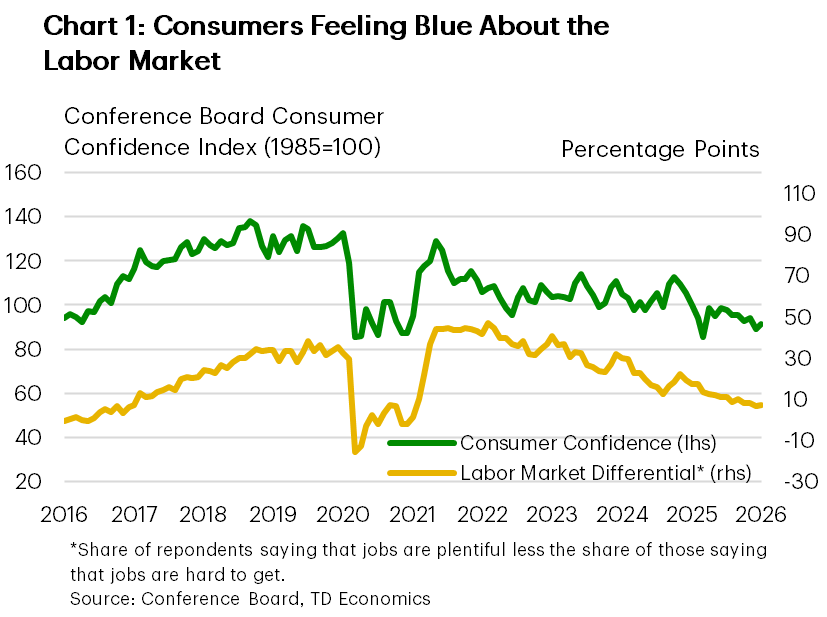
Cost-of-living worries and a slowing labor market remain top of mind for consumers. While consumer confidence index edged up in February, rising from 89.0 to 91.2, the gain was due entirely to improved expectations. Meanwhile, households’ views of current conditions softened further, with the present situation subcomponent declining to its lowest level since the pandemic, pointing to persistent pessimism about the job market. The gap between the share of households saying jobs are plentiful versus hard to get has been narrowing, weighing on confidence (Chart 1).
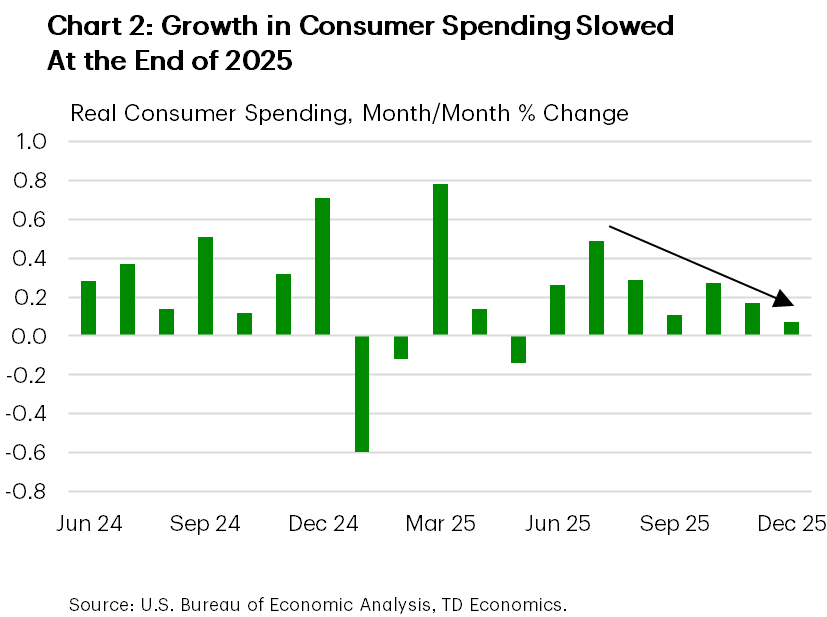
Consumer spending momentum faded at the end of last year (Chart 2), suggesting a weak handoff for Q1 and likely slower spending growth, before a possible Q2 pickup as higher tax refunds arrive. Next week, February’s jobs report should show labor market stabilization, while retail sales and ISM indexes will offer insights into consumer and business activity. We expect these indicators to show the economy continues to chug along despite the uncertainty, keeping the Fed on hold for now, especially with tariff policy in flux and inflation still above target.