Weekly Economic and Financial Commentary
U.S. Review
April Showers on U.S. Home Sales
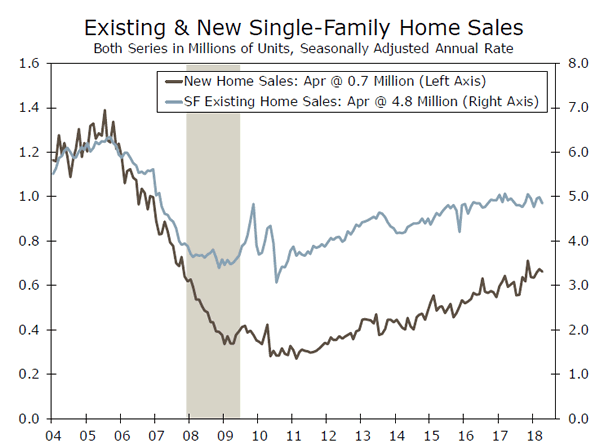
- New and existing home sales each declined in April. New home sales are up 8.4 percent year-to-date as demand remains solid. The average time for homes on the market has declined by three days compared to last year. Rising mortgage rates and home prices could test buyer resolve, however.
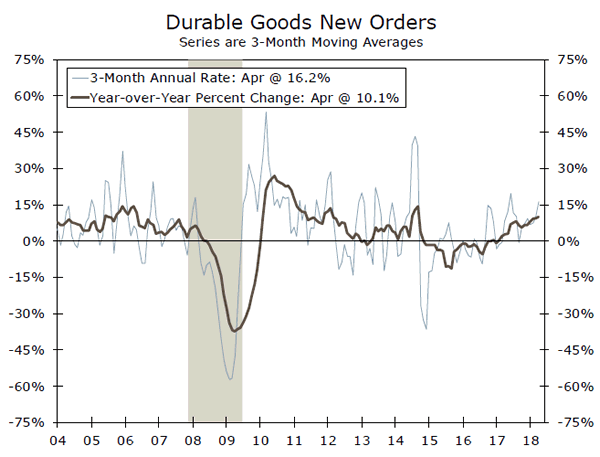
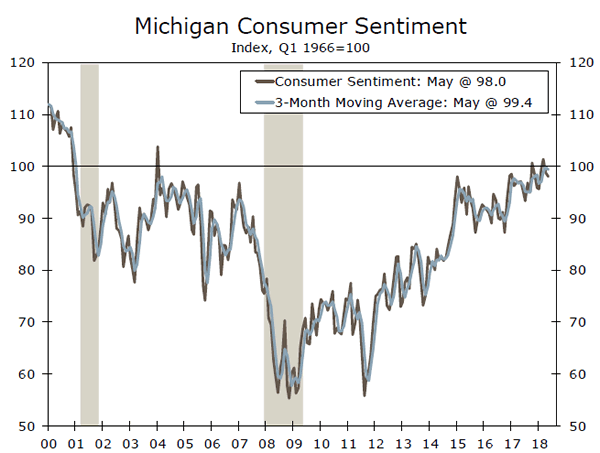
- Durable goods orders disappointed the consensus, falling a greater-than-expected 1.7 percent. A pullback in aircraft orders was the main drag, as core orders rose 0.9 percent. Consumer sentiment fell again in May, but overall consumers remain upbeat about economic conditions.
April Showers on U.S. Home Sales
New home sales declined 1.5 percent in April, dropping to an annual pace of 662,000 units. This was better than the consensus estimate of a 2.1 percent decline; however, March new home sales were revised downward to a 2.0 percent monthly gain from a first reported 4.0 percent rise. New home sales are now 8.4 percent higher year-to-date than this time last year. Sales of new homes that have not yet been started jumped 40,000 units in April, the largest jump in five months, to 221,000 units. This increase in sales of homes not yet started points to strength in housing starts in the months ahead. New home sales are off to a solid start in 2018 behind consistently strong demand due to solid job and income growth. While consumers are eager to buy new homes, rising mortgage rates and home prices will likely serve as a headwind to sales of new homes this year.
Existing home sales also dropped in April, slipping 2.5 percent to a 5.46-million unit annual pace. The pace of existing home sales came in lower than the 5.55-million unit annual pace expected by the consensus. The entirety of the drop came from a slowdown in single-family homes, which were down 3.0 percent on the month, while condos and co-ops picked up by 1.6 percent. The typical home for sale was on the market for just 26 days before being sold in April, down from 29 days a year ago. Homes are selling quickly, which is capping inventory growth. Prices also continue to rise along with mortgage rates, which could dampen demand and price potential buyers out of the market.
Durable goods orders retraced in April following consecutive months of gains. Orders fell 1.7 percent on the month, which was worse than consensus, but more in line with our call for a 2.0 percent drop. Transportation orders fell 6.1 percent as aircraft orders declined a whopping 29 percent. Transportation spending has been a key driver of fixed investment, and backlogs in the sector are rising, which bodes well for future transportation spending. Core capital goods orders, which exclude defense and aircraft orders, rose a solid 0.9 percent on the month. Purchasing manager surveys indicate sustained growth throughout all regions in May, and we expect that the gap between the soft and hard data will converge in coming months.
Consumer sentiment fell once again in May according to the University of Michigan; however, high overall levels of consumer sentiment since the presidential election are consistent with improving economic growth and consumer spending figures. Current economic conditions were responsible for the entirety of the drop in May, driven by rising gasoline prices. Consumers expecting gas prices to rise over the next year jumped 15 points. Consumers are also concerned about household finances as the run-up of asset prices could be reaching their peak in their view. The outlook on business conditions is still generally positive, up 7 points compared to a year ago. Plans for major household appliance and vehicle purchases each dropped. Housing purchase plans continued falling, likely reflecting concern behind rising prices and rates.
U.S. Outlook
Personal Spending • Thursday
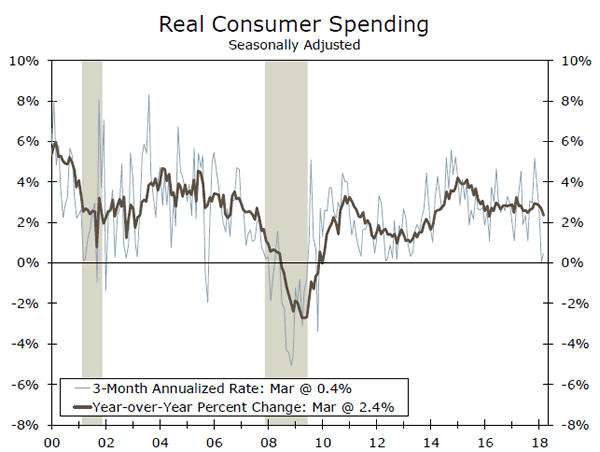
Consumption growth began the year on a soft note in Q1, growing just 1.1 percent annualized. That said, March personal spending data showed that the quarter ended fairly strong with growth climbing 0.4 percent on a month-over-month basis. Looking ahead to April, we expect effects from the tax cuts to start providing greater support to disposable income growth and thus boost spending. April retail sales rose 0.3 percent following a robust 0.8 percent month-overmonth rise in March. We estimate that personal spending will rise 0.4 percent for April. In total we are forecasting real consumer spending to rise 2.9 percent annualized in the second quarter and remain robust through the end of the year. Taking into consideration our outlook for inflation, one of the main risks to our consumption outlook remains a potential erosion of purchasing power due to higher prices.
Previous: 0.4% Wells Fargo: 0.4% Consensus: 0.4% (Month-over-Month)
ISM Manufacturing • Friday
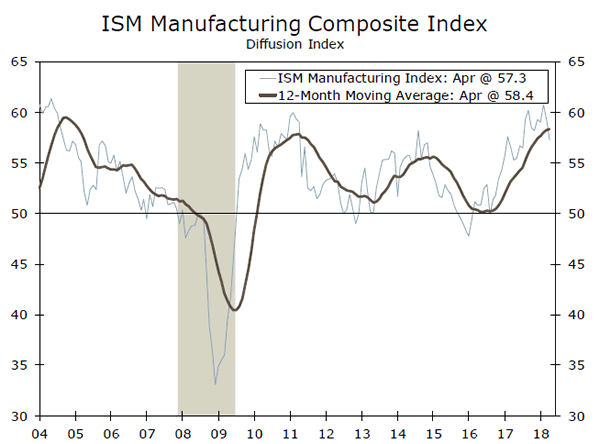
Manufacturing activity as measured by purchasing managers’ responses to the ISM manufacturing survey pulled back slightly in April but remained high at 57.3. The more forward-looking new orders component remained relatively unchanged at 61.2 for the month, while the employment component tumbled over the month to 54.2. One of the areas that we have been watching closely has been the prices paid component which has climbed to 79.3 from 68.3 back in December. The consistent price pressures reported by purchasing managers is in-line with our view for continued upward price pressure through the end of this year. We look for the ISM manufacturing index to rebound slightly, rising to 57.5 in May. With global demand improving and domestic demand remaining robust, the outlook for manufacturing remains positive over the next several quarters.
Previous: 57.3 Wells Fargo: 57.5 Consensus: 58.0
Employment • Friday
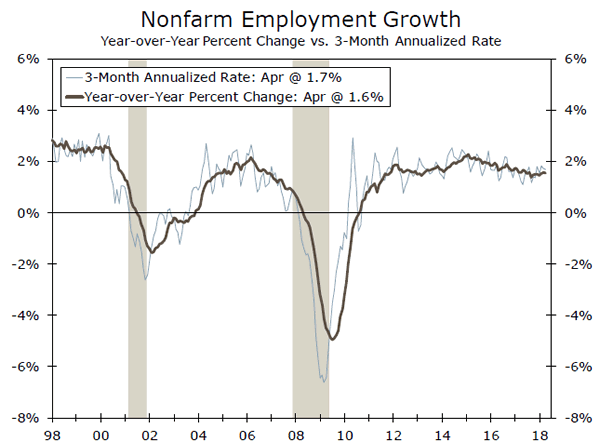
Nonfarm employment rose by a disappointing 164,000 in April to start the second quarter, but the unemployment rate still fell to 3.9 percent. Job gains remained broad-based with the exception of wholesale trade and government. The focus remains on average hourly earnings for signs of inflation pressures. The earnings measure was up 2.6 percent on a year-over-year basis as of April. For May’s nonfarm print we suspect that 180,000 jobs were added for the month, and the unemployment rate is likely to remain stable at 3.9 percent. We expect the pace of job growth to gradually decelerate as the year progresses and the labor market continues to tighten. After averaging 212,000 jobs per month in the first quarter, we see the pace of job gains downshifting to around 170,000 in the second and third quarters. Another byproduct of the tighter labor market conditions should be higher average hourly earnings in the coming months.
Previous: 164K Wells Fargo: 180K Consensus: 190K
Global Review
Global Economy Shows Mixed Results at the Start of Q2
- According to recently released data, Q2 started with mixed results after a relatively weak first quarter. Although data on consumption seem to have picked up a bit at the start of Q2, data on production seemed to have continued to weaken from the highs seen at the end of 2017.
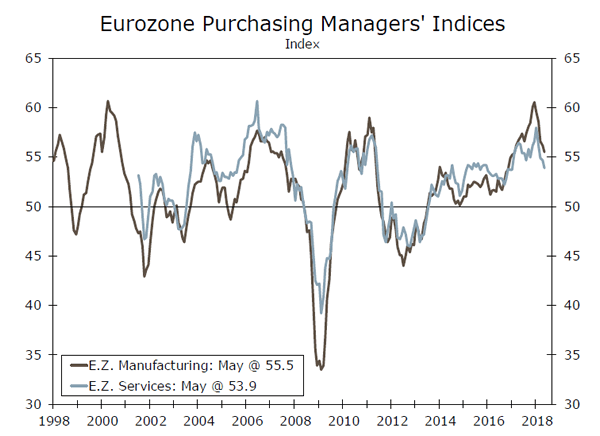
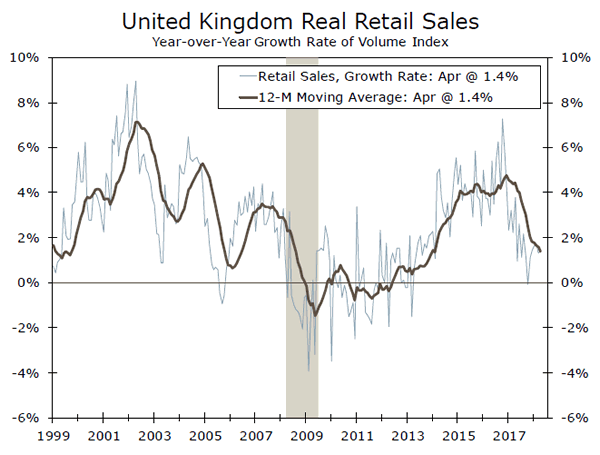
- U.K. retail sales increased 1.6 percent sequentially in April, the strongest monthly print since the 2.5 percent increase recorded in April of last year. In the Eurozone, the manufacturing sector continued the weakening trend it has shown since December 2017 as the Markit/BME manufacturing PMI printed 55.5 in May compared to 56.2 in April.
Global Economy Shows Mixed Results at the Start of Q2
According to recently released data, the second quarter started with mixed results after a relatively weak first quarter. Although data on consumption seem to have picked up a bit at the start of Q2, data on production seemed to have continued to weaken from the highs seen at the end of 2017.
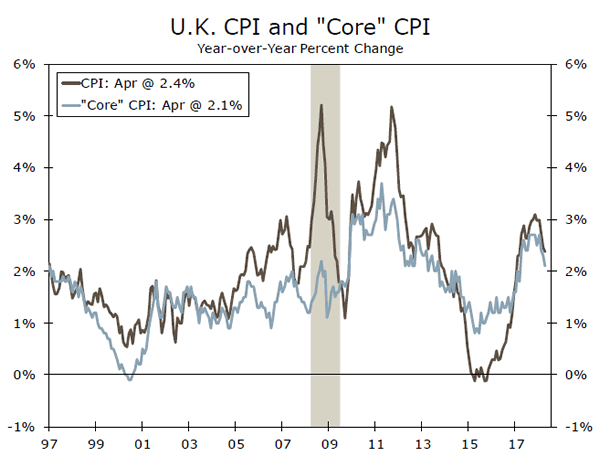
Consumer prices in the U.K. increased a less-than-expected 0.4 percent in April, but they were up compared to an increase of 0.1 percent in the previous month. However, the year-over-year rate came in a bit lower than expected, at 2.4 percent versus 2.5 percent for the year ending in March. The core CPI was also lower than expected, up 2.1 percent on a year-earlier basis compared to 2.3 percent for the year ending in March. Both measures point to continued disinflation after CPI inflation hit a year-over-year high of 3.1 percent in November of last year. This will probably give pause to some of the speculation regarding the Bank of England needing to start increasing rates sooner rather than later.
On the other hand, retail sales in the U.K. increased 1.6 percent sequentially in April, the strongest monthly print since the 2.5 percent increase recorded in April of last year. Meanwhile, the detailed demand-side data on Q1 GDP showed a relatively weak economy in Q1, but for the same reasons as in Germany (see below). The external sector was weak, while private consumption was a bit stronger, up 0.2 percent versus expectations of a 0.1 percent increase, sequentially and not annualized.
In the Eurozone, the manufacturing sector continued the weakening trend it has shown since December 2017, as the Markit/BME manufacturing PMI printed 55.5 in May compared to 56.2 in April. Meanwhile, the German manufacturing PMI was down more than the Eurozone aggregate in May, down to 56.8 compared to 58.1 in April. Furthermore, detailed demandside GDP numbers were released for Germany in Q1 showing a relatively strong consumer compared to expectations, up 0.4 percent not annualized, while government spending was down a larger-than-expected 0.5 percent and capital investment up a more-than-expected 1.7 percent, sequentially. The weakest sector during Q1 was the external sector, with real exports of goods and services declining 1.0 percent while imports of goods and services declined 1.1 percent. Meanwhile, Germany’s GfK consumer confidence index for June weakened a bit, from 10.8 to 10.7 in May, while the IFO index came in mixed. The business climate index was flat in May at 102.2; the expectations index was slightly lower, 98.5 compared to 98.7 in April, while the current assessments index was up 106.0 compared to 105.8 in April.
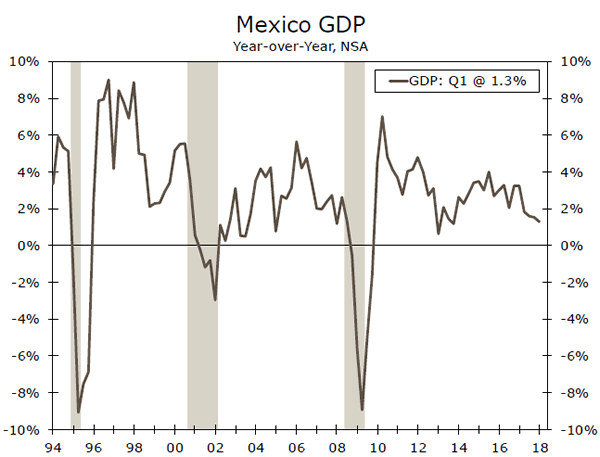
In Mexico, revised data for Q1 GDP showed a weak economy on a year-earlier basis, not seasonally adjusted, up 1.3 percent, while up a relatively strong 1.1 percent sequentially and not annualized. As we argued before in previous reports, there is lots of noise in this release due to the difference in occurrence of the Easter season compared to last year. However, what is clear from the information on Q1 is that domestic consumption continues to drive economic growth while the industrial sector remains relatively weak.
Global Outlook
Bank of Canada Policy Meeting • Wednesday
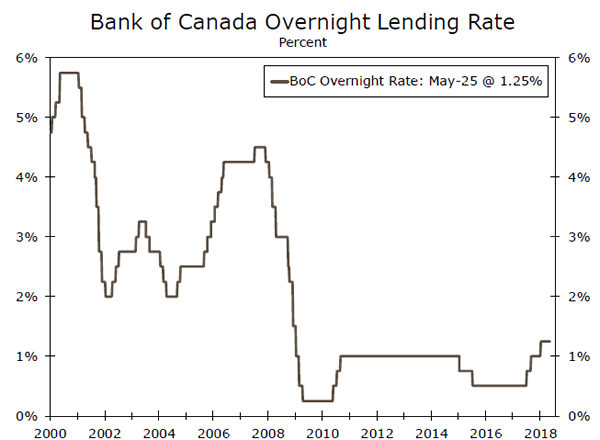
The Bank of Canada holds a regularly-scheduled policy meeting on Wednesday. After hiking rates in January, the BoC subsequently remained on hold in March and April and we, and most other analysts, expect that the BoC will keep policy unchanged again on Wednesday. Policymakers did not express any particular urgency to raise rates in the statement they released after the last policy meeting in April, although they did seem to indicate that further tightening will be appropriate later. Indeed, we look for the BoC to raise rates again in the third quarter.
Canada will release GDP data for the first quarter on Thursday. Real GDP rose at an annualized rate of 1.7 percent in Q4-2017, and we project that the economy grew at a roughly similar rate in Q1. Rates remain low in a historical context, and we believe that the BoC will eventually need to tighten further to return rates to a more “neutral” (i.e., neither stimulating nor restraining the economy) setting.
Previous: 1.25% Wells Fargo: 1.25% Consensus: 1.25%
Japan Industrial Production • Thursday
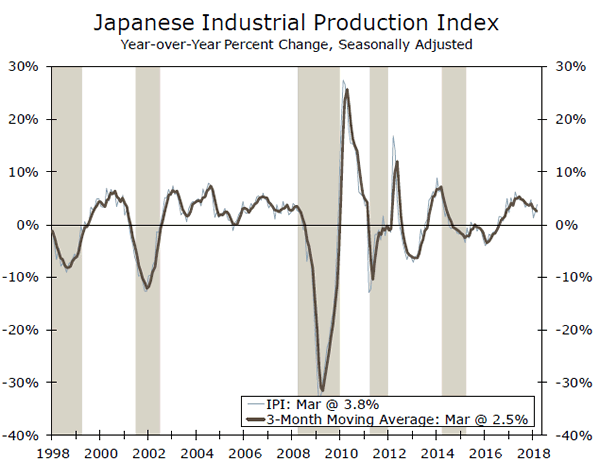
Real GDP in Japan edged down at an annualized rate of 0.6 percent in Q1-2018, the first contraction on a sequential basis in more than two years. Some of the decline in real GDP reflects the 5.3 percent nosedive in industrial production (IP) that occurred during the quarter. IP ended the quarter on a strong note, however, and most analysts look for IP to post another strong rise in April. If it does, then the recent momentum in IP should go a long way toward returning overall GDP growth to positive territory in Q2.
We will get more information on Tuesday through Thursday about the current state of the Japanese economy via April data on retail spending, unemployment and construction orders. Even if growth returns to positive territory, however, Japan is not likely to experience meaningful inflation anytime soon, which should induce the Bank of Japan to refrain from tightening policy.
Previous: 1.4% Consensus: 1.4% (Month-over-Month)
Eurozone CPI Inflation • Thursday
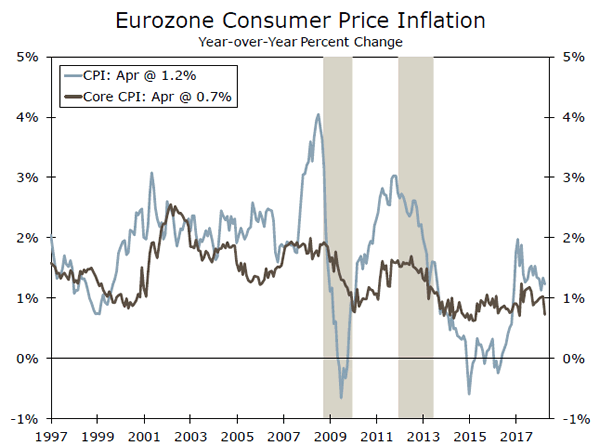
The European Central Bank attempts to keep CPI inflation “below, but close to, 2 percent over the medium term.” However, inflation has generally been well below the ECB’s target since early 2013. The overall CPI inflation rate was only 1.2 percent in April; preliminary data that will be released on Thursday likely will show that inflation has remained below target in May. Although the recent rise in gasoline prices likely will push up the overall rate of inflation in coming months, the “core” rate of inflation probably will not move significantly higher anytime soon.
There are also some indicators of real economic activity on the docket next week. Germany will release retail spending data in April at some point during the week, and the labor market report will print on Wednesday. In France, data on consumer spending in April are slated for release on Wednesday.
Previous: 1.2% Consensus: 1.6% (Year-over-Year)
Point of View
Interest Rate Watch
Fed Minutes: Something for Everyone
The minutes from the May FOMC meeting, which were released on Wednesday, had a little bit of something for everyone. For the hawks, the use of the word “soon” in reference to the next tightening move suggests a June rate hike is a lock. For the doves, committee members once again signaled their willingness to let inflation drift a bit above 2 percent, even suggesting that allowing it to do so “could be helpful in anchoring longer-run inflation expectations at a level consistent with that objective [2 percent inflation].” Trade war concerns were top of mind for some participants as a potential risk to the outlook.
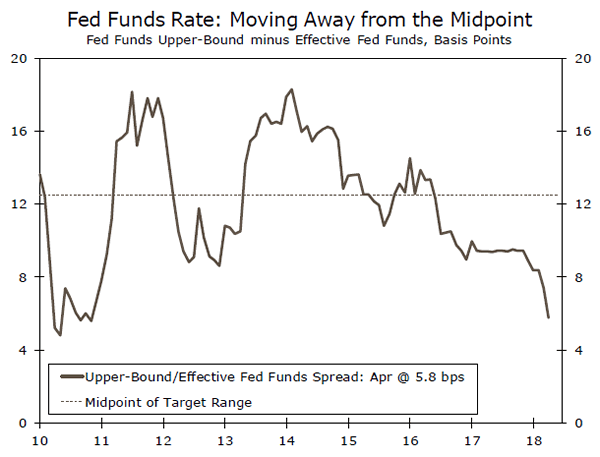
IOER: Getting Technical
Perhaps the most intriguing development in the minutes was the suggestion that at some point in the near future the Fed might not hike the rate paid on interest on excess reserves (IOER) one-for-one with the fed funds rate. Currently, the Fed sets IOER in line with the upper bound of the fed funds target range. By paying IOER, the Fed effectively creates a floor under short-term interest rates, as lenders have little incentive to lend excess reserves in the fed funds market at a rate much below IOER.
Recently, however, the effective fed funds rate (which should sit roughly between the lower and upper-bound of the target range) has moved ever closer toward the upperbound of the range (middle chart). Without delving too deeply into the weeds, the main culprit seems to have been the surge in short-term government borrowing that occurred to start the year (bottom chart).
From an economic standpoint, this move by the FOMC is more of a technical adjustment than a material change to monetary policy. More broadly, however, this tweak hints at a much deeper question the Fed faces in the years ahead. As balance sheet normalization continues, will the Fed eventually return to the pre-crisis method of implementing monetary policy through minimal excess reserves and open market operations? Or will the Fed stick to its current method of maintaining a historically large balance sheet and utilizing IOER to influence shortterm interest rates? Only time will tell.
Credit Market Insights
Bank Assets Show Stable Conditions
The Federal Reserve’s H.8 release, which estimates the assets and liabilities of commercial banks in the United States, showed steady credit growth in April. After starting the year at a relatively slow pace, total bank credit was up at an annualized rate of 2.9 percent last month.
Much of the gain had been fostered by stronger growth in commercial and industrial (C&I) loans. C&I loans rose 14 percent in April, on an annualized basis, which was the fastest print since March 2015. As companies typically borrow to meet future demand, we would expect that businesses are optimistic about future consumer appetites. Similarly, financial conditions appear to remain supportive of business spending, as the Fed’s, separately released, Senior Loan Officer Opinion Survey shows banks on net easing standards on business loans over the past year.
The consumer segment also added to bank credit growth in April, with credit cards and other revolving plans up 4.8 percent, annualized. While income gains remain subdued, we expect this sector of borrowing to continue to rise in coming months, as consumers utilize alternative means to fund their spending habits. These conditions favor our outlook of a rebound in personal consumption in the second quarter, after temporary weakness experienced in the first.
Overall, bank credit growth remains stable, as it appears businesses and consumers are continuing to fuel this expansion.
Topic of the Week
Treasury Financing: A Tough Road Ahead
On April 9, the Congressional Budget Office (CBO) released its annual Budget and Economic Outlook, stepping through its projections for the economy, the federal budget and the deficit outlook for the next 10 years. Much of the recent attention has been on the short-term challenges in Treasury financing, but CBO’s report highlights that the long-run outlook remains grim.
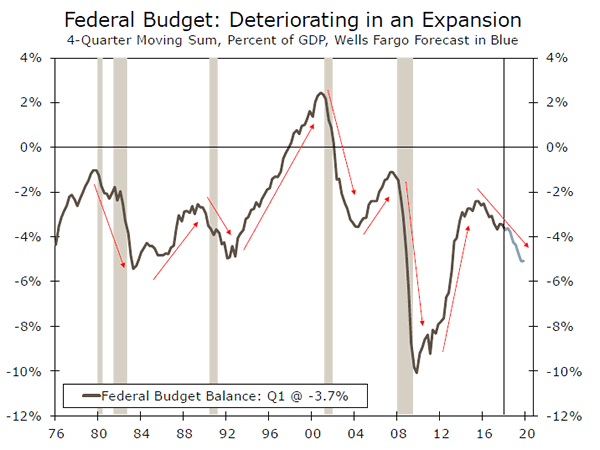
Despite stronger predicted economic growth in the short term, a combination of tax cuts and surging spending have led the budget deficit to widen as a share of GDP, with more deterioration expected over the next year or two. This pattern is historically unusual, as budget deficits typically expand during recession, gradually close during the recoveries and then begin widening again at the next onset of economic weakness (top chart).
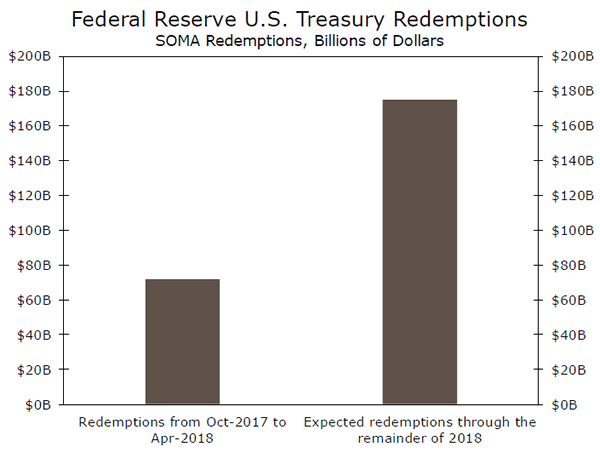
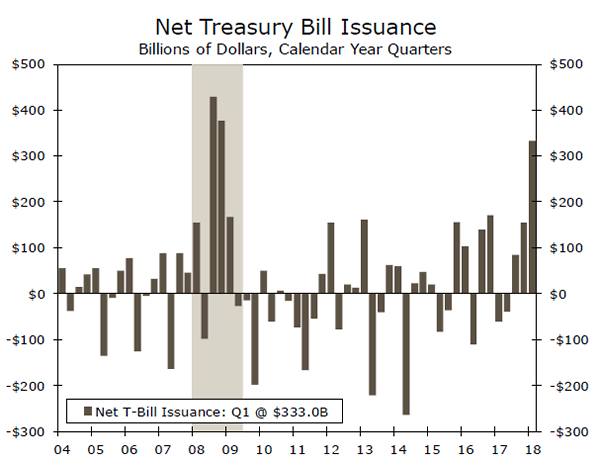
Over the long run, swelling mandatory outlays and mounting interest payments are expected to outpace future revenue gains, thus widening the federal deficit. CBO expects that mandatory spending, which includes outlays for the major healthcare programs and Social Security, will eclipse 64 percent of total federal spending by 2028. This grim fiscal outlook is playing out as the Fed normalizes its balance sheet, requiring the Treasury to issue even more debt to the public (bottom chart).
In the wake of CBO’s report, the yield on the 10-year Treasury climbed 35 bps, reaching a high of 3.11 percent on May 17 before receding back to about 2.93 percent as of today. To what extent the run up in the 10-year Treasury has been attributable to CBO’s report is difficult to quantify. However, concerns about widening deficits are certainly playing a role in rising yields, and with the story unlikely to change in the near future, we continue to believe interest rates will continue rising the remainder of the year. The challenges associated with debt financing are a reminder that first order effects on the economy from a policy move (e.g. a boost to growth from tax cuts) can be partially offset by second and third order fallout (e.g. growth challenges from higher interest rates).