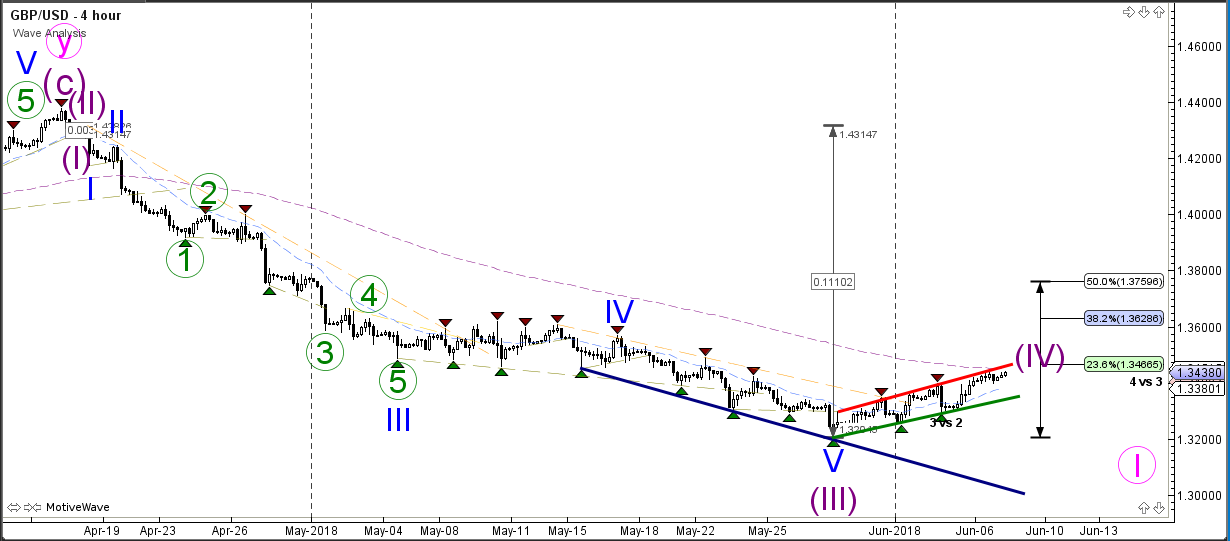
The GBP/USD is building a bear flag chart pattern within a wave 4 (purple) correction. The Fibonacci levels of wave 4 could act as resistance and a break below the channel could indicate the end of wave 4 and the start of wave 5. A break above the 50% makes a wave less likely.
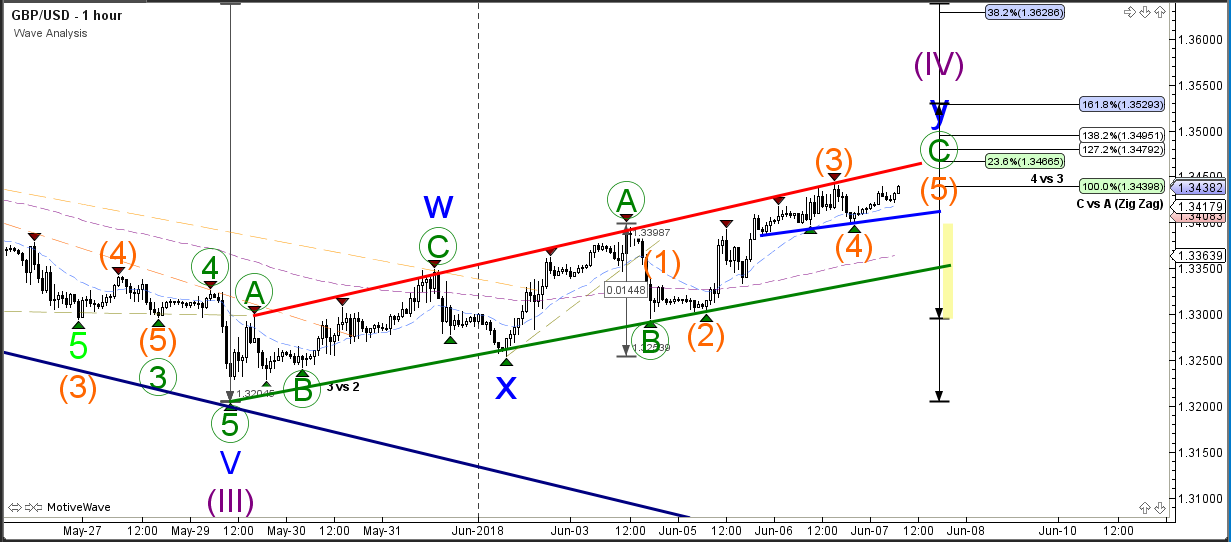
The GBP/USD is expanding the bullish wave 5 (green) after bouncing at support (blue). Price is now approaching a confluence of resistance at the Fibonacci targets and trend channel top, which offers a new bounce or break zone.