EUR/USD
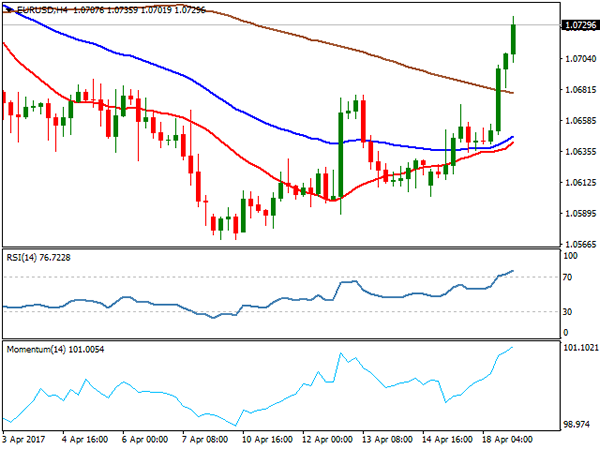
The EURUSD pair was dragged by strong rally of sterling and overall weaker dollar and rallied strongly on Tuesday, gaining almost 1% in the biggest one-day rally since Mar 15 that hit fresh three-week high above 1.0700 breakpoint. Lift above 1.0700 signalled extended correction of 1.0906/1.0570 descend, as the pair approaches next pivot at 1.0738 (daily Kijun-sen line / 50% retracement). Daily close above 1.0700 is seen as strong bullish signal, while extension above Kijun-sen barrier is needed to confirm bullish continuation which may extend towards next significant barrier at 1.0776 (Fibonacci 61.8% retracement).
The Euro will be looking for Wednesday’s release of Eurozone CPI data for March, which may further boost teh single currency in better-than-expected release (CPI m/m is forecasted at 0.8% in March compared to 0.4% in Feb, while annualized inflation is seen unchanged at 1.5% in March.
The pair is also looking for Eurozone’s Trade Balance which is expected to show significant surplus in March (forecast is for 16.2 billion Euros surplus vs 600 million deficit in Feb).
Tuesday’s strong rally improved the structure of daily technical studies which became more supportive for further gains.
Broken 1.0700 barrier now acts as support, reinforced by 20SMA, which should ideally contain dips and keep fresh bulls intact.
Support: 1.0700. 1.0677. 1.0663. 1.0636
Resistance: 1.0738. 1.0777. 1.0800. 1.0826
USD/JPY
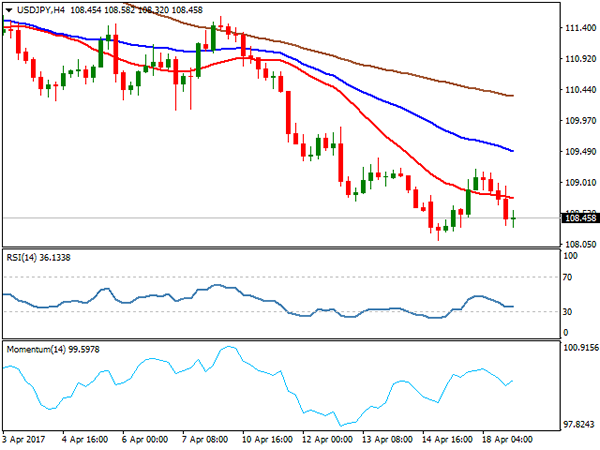
USD JPY came under pressure again and ended day in red, also closing below 200SMA, after failing to capitalize from bullish signal for stronger recovery, marked by Monday’s long-tailed daily candle. The pair dipped below hourly Ichimoku cloud (spanned between 108.74 and 108.48 that was acting as solid support initially) after failure to sustain break above 109.00 handle.
Limited corrective action was forecasted on yesterday’s technical comment, as technical studies remain in firm bearish mode and so far ignore strongly oversold daily studies, on the way to key near-term support at 108.11 (Monday’s fresh five month low).
negative sentiment on strong safe haven buying on rising geopolitical tensions keeps yen well supported for further advance against the US dollar.
The pair is currently riding on the third wave of five-wave cycle from 118.60 and looking for close below cracked 100% Fibonacci Expansion level at 108.48, to validate wave principles and open way extension towards 106.82 (FE 123.6%).
Interim support lies at 107.86 (Fibonacci 61.8% retracement of 101.18/118.65 rally).
Support: 108.32. 108.11. 107.86. 107.00
Resistance: 108.94. 109.22. 109.43. 109.84
GBP/USD
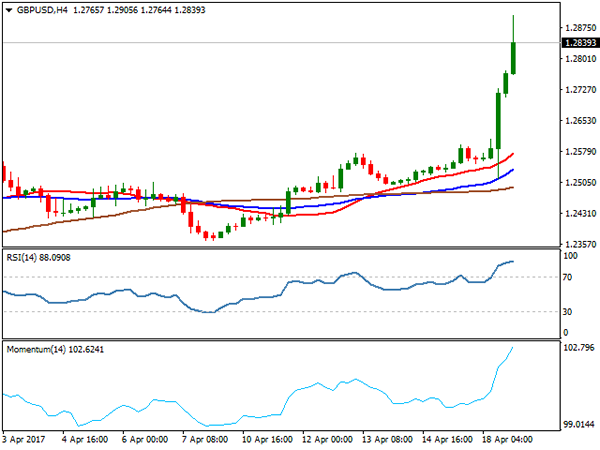
British pound was top performer on Tuesday, gaining over 2.2% against the dollar, on the biggest one-day rally after 17Jan surge. The pair was in quiet mode during Asian and early European session, before jumping on the roller-coaster. News that UK PM Theresa May was going to deliver the statement in front of her Downing Street 10 office, signalled something serious ahead. Initial rumours about May’s possible resignation pushed pound around 100-pips lower to hit daily low at 1.2513 against the greenback. After speculations proved to be false, sterling recovered almost all losses, and surged higher after PM May announced early election in UK, scheduled for June 8. May said that early election was the only way to guarantee political stability for the two-year process of divorce from the EU which started last month on triggering an Article 50.
In strong bullish acceleration, cable surged through three round-figure barriers and extended well above the top of post-referendum 1.2722/1.1986 consolidation phase, generating bullish signal for stronger correction of 1.5015/1.1986 fall.
The pair hit daily high at 1.2905, opening way towards psychological 1.3000 barrier and signalling possible extension towards next pivotal barriers at 1.3113/43 (weekly Ichimoku cloud base / Fibonacci 38.2% retracement of 1.5015/1.1986 downleg, on fresh strong bullish sentiment.
Profit-taking on strong Tuesday’s rally should be anticipated, however, no firmer bearish signals being generated for now. Initial support lies at 1.2800 zone, followed by pivot at 1.2755 (38.2% of Tuesday’s rally) with stronger pullback expected to hold above 1.2663 (Fibonacci 61.8%) to keep strong bulls intact for fresh upside attempts.
Support: 1.2800. 1.2755. 1.2704. 1.2663
Resistance: 1.2905. 1.2950. 1.3000. 1.3060
AUDUSD
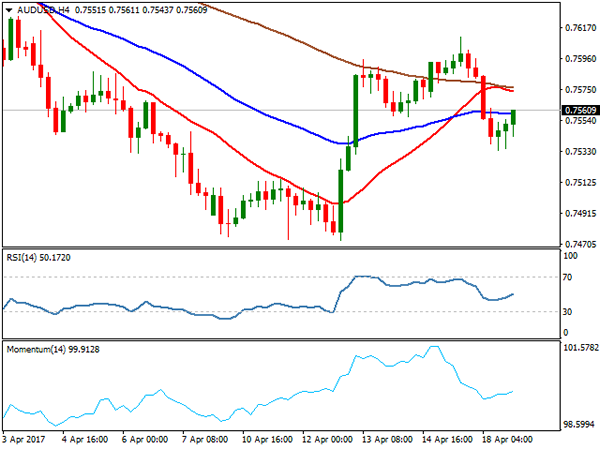
The Aussie dollar fell sharply on Tuesday, making the first day in red after four straight days of strong gains. Pullback from recovery high at 0.7610, where rally was capped by daily Tenkan-sen line, on failure above daily cloud top, has accelerated after release of minutes of RBA’s April policy review when the central bank held rates steady at record 1.5% low, as minutes suggested caution on rate views. The pair was also under pressure ahead of comments of US Vice President Pence in Tokyo on continued tensions over North Korea.
The pair spiked to 0.7533 low of the day and the lowest since Apr 13, on probe below pivotal 200SMA at 0.7550, but was unable to close below it, as the price bounced on profit-taking action.
Indicators on daily studies are in negative territory and signal increased downside risk, which requires close below 200SMA to trigger further weakness for test of next strong support at 0.7519 (100SMA).
Meantime, corrective attempts should be capped under 0.7570 (4-hr cloud top / Tenkan-sen) to keep fresh bearish sentiment in play.
Support: 0.7541. 0.7533. 0.7519. 0.7500
Resistance: 0.7570. 0.7605. 0.7611. 0.7630
GBPCAD
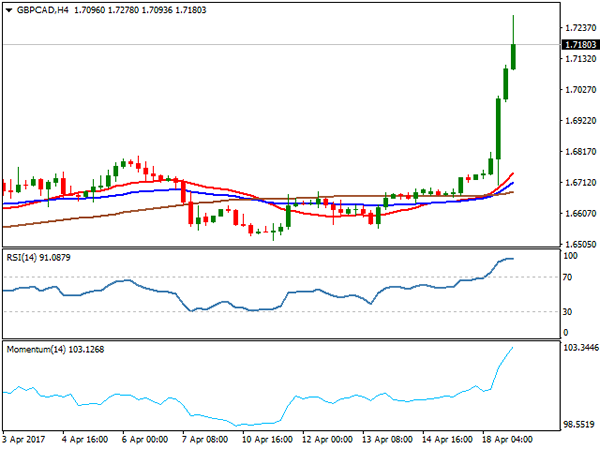
The GBPCAD cross surged to 1.7278 on Tuesday, hitting the highest since end of Sep 2016, on strong rally of the pound, which was boosted by surprise call for snap election in UK.
Strong rally that took initial barriers at 1.6800/88, as well as psychological 1.7000 barrier, penetrated into thick weekly Ichimoku cloud (cloud base lies at 1.7078) to peak at 1.7278.
Tuesday’s strong bullish acceleration broke above med-term consolidation between 1.7119 and 1.5736 and also confirmed double-bottom at 1.5736 (Oct/Jan lows) that is seen as another bullish signal for extension towards net target at 1.7524 (15 Sep 2016 peak).
Support: 1.7100. 1.7000. 1.6896. 1.6806
Resistance: 1.7278. 1.7454. 1.7524. 1.7542
GOLD
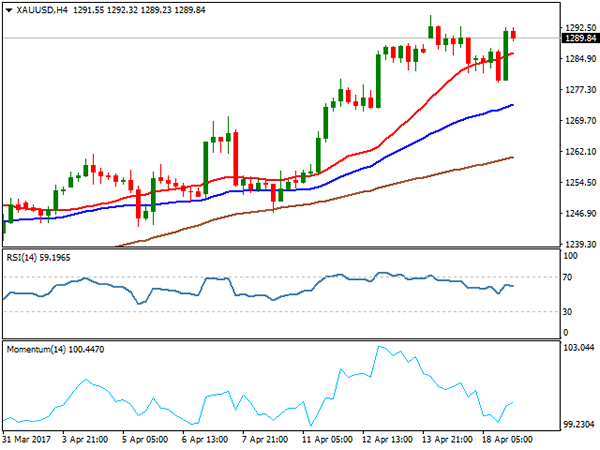
Spot Gold remained steady on Tuesday and bounced back to $1292 after posting marginally lower correction low at $1279. The yellow metal remains supported by geopolitical tensions that boost its safe haven appeal and also by weaker dollar. Extended consolidation is expected to precede fresh attack at psychological $1300 barrier and extension towards next target at $1307 on break.
Technical studies remain firmly bullish but overextended that requires caution. However, strong global risk-off mode for now offsets threats of stronger correction on overbought daily RSI / slow stochastic.
Bearish scenario would require firm break below $1277 pivot to signal stronger correction.
Support: 1281. 1279. 1277. 1271
Resistance: 1292. 1295. 1300. 1307
WTI CRUDE OIL
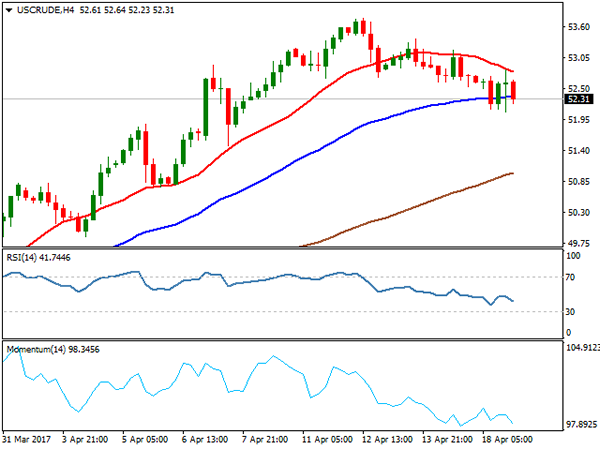
WTI oil remains at the back foot for the fourth consecutive day and extended pullback from fresh five-week high at $53.74 to $52.09, slightly below Fibonacci 23.6% retracement of $47.07/$53.74 rally.
Daily slow stochastic is heading south and showing more room at the downside, after signalling correction on forming bearish divergence. Correction should be ideally contained at $51.66 (daily 55/100SMA bull-cross) to keep intact overall bullish sentiment which was dented by surge in US shale oil output that offsets attempts of oil producers to curb global oversupply by cutting output and boost oil prices.
Conversely, extension below $51.66 would risk test of next pivot at $51.19 (Fibonacci 38.2% retracement) loss of which would signal deeper correction.
Support: 52.09. 51.76. 51.19. 50.41
Resistance: 52.83. 53.18. 53.37. 53.74
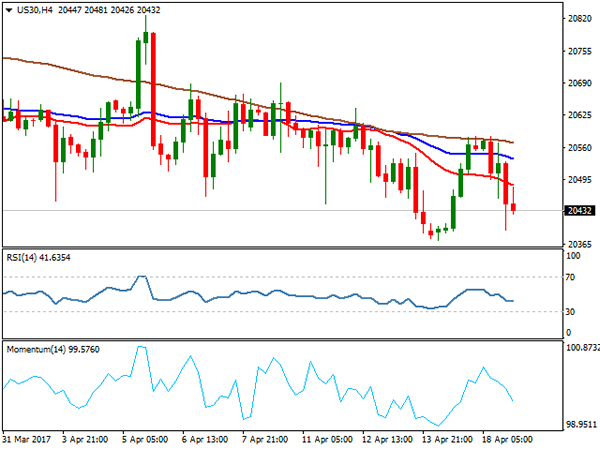
DJIA
Dow was dragged lower on Tuesday as call for general election in UK added to the list of uncertainties for investors which were heated by growing tensions from North Korea, through Middle East to France.
Dow was down 0.6% on Tuesday, on bearish acceleration after Monday’s recovery was capped by 20/55AMA bear-cross. This has added on already weak technical outlook and increased risk of renewed probe below key daily Ichimoku cloud base support at 20385, which so far managed to contain two attacks. Firm break below cloud base would be seen as strong signal for fresh extension of pullback from all-time high at 21160 (posted on Mar 1) for test of 20266 (Fibonacci 61.8% of 19713/21160 ascend).
Daily Tenkan-sen / Kijun-sen lines in firm bearish a=setup are supportive for further weakness.
Support: 20385. 20266. 20126. 20068
Resistance: 20481. 20580. 20600. 20692
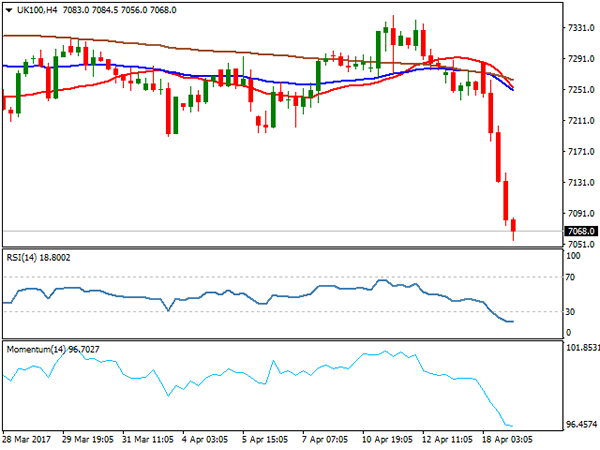
FTSE100
FTSE100 index was among the top losers on Tuesday, as the index was pushed strongly down on UK election decision and sharply higher pound, on the first working day after extended Easter holiday break. FTSE lost nearly 3% on Tuesday’s strong bearish acceleration from day’s high at 7285 to the lowest of the day at 7056.
Sharp fall that surged through strong support, shaped in rising daily Ichimoku cloud (7253/7184) has weakened daily technical studies which gained strong bearish momentum for further downside, as the price is eyeing key med-term support at 7024 (Feb 2 trough) for full retracement of 7024/7444 rally.
Also completion of asymmetric Head & Shoulders pattern on daily chart adds on strong bearish pressure.
Support: 7056. 7024. 7000. 6954
Resistance: 7100.7125. 7192. 7235
DAX
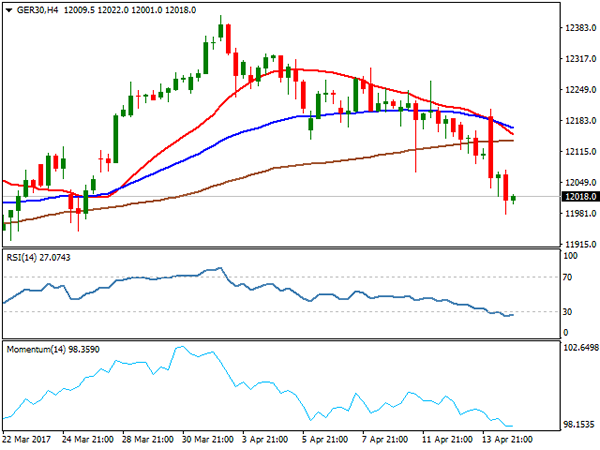
DAX was firmly in red on Tuesday, following general negative trend for stocks and losing 1.4% for the day. Extension of pullback from record high at 12410 (posted on Apr 03) extended below psychological 12000 support and retracing over 76.4% of 11878/12410 upleg.
Tuesday’s long red daily candle weighs on market as daily technical studies are losing traction. Near-term risk is turned lower, as index is eyeing key short-term support at 11878 (Mar 22 low) for full retracement of 11878/12410 bull-leg, loss of which would trigger further easing. Tuesday’s fall found temporary footstep at daily 55SMA, with limited upside attempts expected ahead of final push towards 11878 target.
Support: 12000. 11960. 11878. 11718
Resistance: 12081. 12162. 12220. 12267