
The USD/JPY is in a highly corrective consolidation zone. Price action is now offering multiple price patterns that could offer interesting ways of analysing the charts.
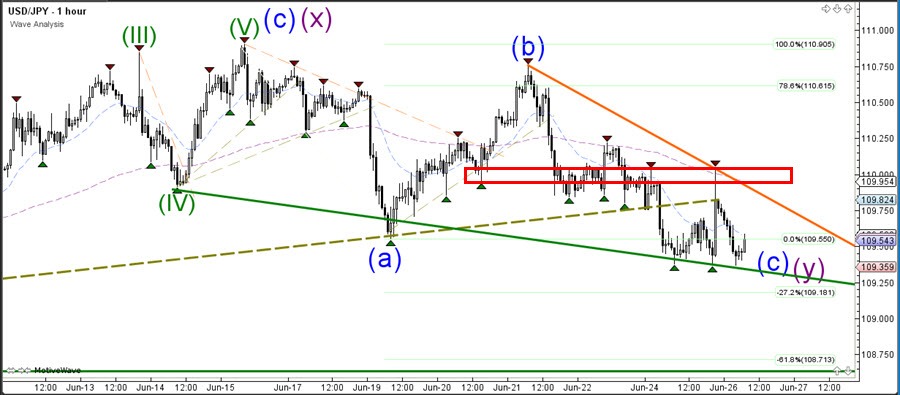
The USD/JPY seems to be building a triangle pattern (red/blue lines) and a falling wedge chart pattern (orange/green lines) at the same time. A bearish breakout could see a continuation towards the previous support zone (horizontal green) and a potential inverted H&S pattern.
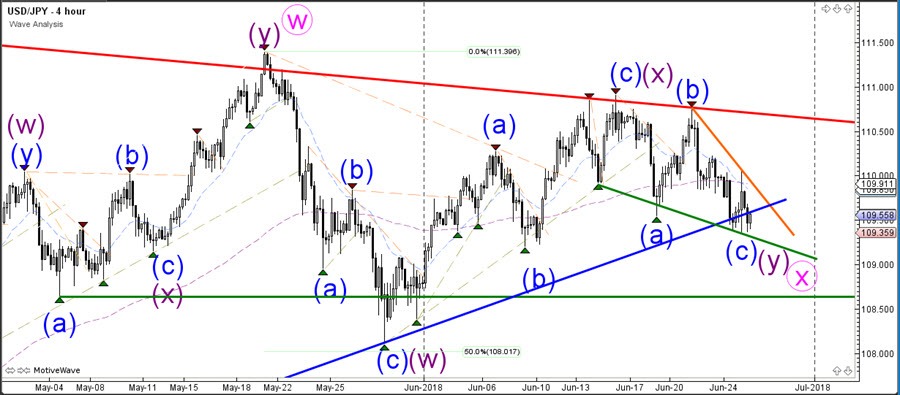
The USD/JPY remains choppy and needs to break support or resistance before a larger price movement could be expected. A bullish break above 110 or a bearish break below 109 could see the start of momentum.


