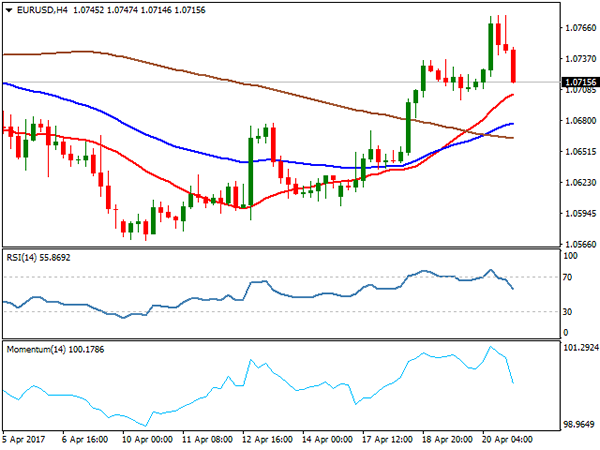
EUR/USD
The EURUSD pair broke above daily Kijun-sen barrier at 1.0738 which capped upside attempts in past two day and met next target at 1.0776 (Fibonacci 61.8% retracement of 1.0906/1.0570 downleg. Initial attempt higher was short-lived, as the pair failed to hold gains and fell back bear key 1.0700 support after strong bearish signal was generated on formation of hourly double-top pattern.
Quick reversal was so far contained by the top of hourly Ichimoku cloud (spanned between 1.0715 & 1.0685) within 1.0700 support lies, marking strong support zone.
Dips are expected to hold above these supports in order to keep near-term studies in bullish alignment, as the pair remains biased higher overall, keeping positive tone ahead of Sunday’s French election.
However, close below Kijun-sen line and Thursday’s daily candle with long upper wick is expected to weigh on near-term action.
The pair may hold in extended consolidation between 1.0700 and 1.0738 ahead of releases of Eurozone PMI data, due on Friday which are expected to come out slightly below previous month’s figures and may further pressure the Euro on weaker-than-expected numbers.
Bearish scenario requires firm break below hourly Ichimoku cloud to signal further retracement of 1.0601/1.0776 upleg.
Otherwise, renewed attempts higher could be expected while 1.0715/00 supports hold. Close above daily Kijun-sen will be bullish signal, while lift above 1.0776 pivot would signal bullish continuation towards 1.0800/26 targets.
Support: 1.0715, 1.0700, 1.0684, 1.0658
Resistance: 1.0738, 1.0777, 1.0800, 1.0826
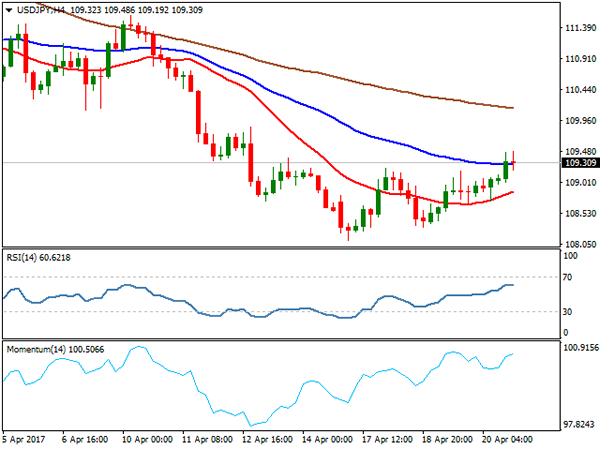
USD/JPY
USD JPY pair is on track for the second consecutive bullish daily close, signalling that consolidation above fresh low at 108.11 may extend higher. Thursday’s rally that firmly broke above 200SMA (108.87) and now acting as support, also cracked next pivot at 109.43 (Fibonacci 38.2% retracement of 111.57/108.11 downleg), signalled fresh strength of the dollar, despite weaker-than-expected releases of US economic indicators. US weekly jobless claims rose by 10K to 244K, above forecasted 242K, while Philadelphia Fed Manufacturing Index came at 22.0 in April, missing forecast at 25.0 and holding well below 32.8 release of March.
Extended recovery on close above 109.43 may challenge next strong barriers at 109.84 (daily Tenkan-sen) and psychological 110.00 barrier, as daily indicators that emerged from oversold territory show more room at the upside.
The pair is also on track for positive weekly close after two consecutive weeks in red which may signal further recovery.
Firmer bullish signal could be expected on sustained break above 109.84/110.00 pivots.
Support: 108.85, 108.68, 108.32, 108.11
Resistance: 109.48, 109.84, 110.00, 110.25
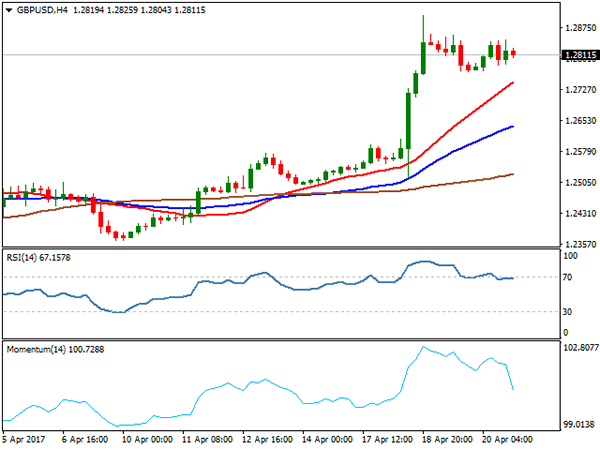
GBP/USD
GBPUSD currency pair remains in extended consolidation below fresh multi-month high at 1.2905, with downside being limited at 1.2770 (lows of Wed / Thu). Consolidation is forming bullish flag pattern on 4-hr chart which may signal fresh upside attempts towards 1.2905 and attack at psychological 1.3000 barrier in extension. Strong bullish sentiment continues to underpin the pound, along with bullish technical studies.
However, risk of deeper correction remains on the table, signalled by extended daily studies, as daily RSI and slow stochastic are hovering around overbought boundary line, but remain in sideways mode in the near-term and without firmer bearish signal so far.
On the other side, cable is on track for the second strong weekly close which is seen supportive for fresh advance.
Initial support lies at 1.2770, guarding 1.2750 (Fibonacci 38.2% retracement of 1.2500/1.2905 rally) and firm break here would generate stronger bearish signal for extended pullback.
The pair is looking for release of UK Retail Sales data for March on Friday, which may impact pair near-term action. Monthly Retail Sales are forecasted at -0.2% in March, well below Feb’s 1.4% release, with forecast for annualized Retail Sales at 3.4%, also being under previous month’s release at 3.7%.
Support: 1.2701, 1.2750, 1.2702, 1.2654
Resistance: 1.2846, 1.2859, 1.2905, 1.2950
AUDUSD
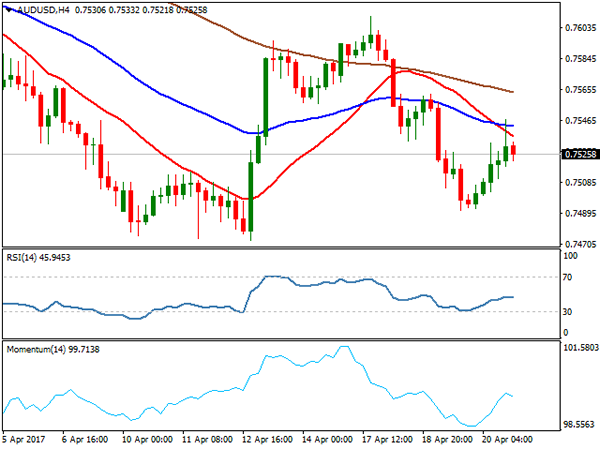
The AUDUSD pair recovered part of past two-day strong fall from 0.7610 that found footstep at 0.7490, just ahead of key near-term support at 0.7472 (lows of Apr 10,11,12 / base of thick daily Ichimoku cloud). Thursday’s bounce could be seen as a breather of downmove from 0.7610, before final attack at 0.7472 pivot, as daily technical studies remain in firm bearish setup and extended upticks on Thursday were capped under 200SMA (0.7550) and remain below strong resistance zone at 0.7541/50, formed by daily Tenkan-sen and 200SMA.
While the latter barriers hold, the downside is expected to remain at risk for renewed attempt through 0.7472, which would signal stronger bearish acceleration and expose targets at 0.7453 (50% retracement of 0.7158/0.7749 rally) and 0.7384 (Fibonacci 61.8% retracement) in extension.
Alternative scenario needs firm break and close above 200SMA to shift near-term focus higher.
Support: 0.7510, 0.7490, 0.7472, 0.7453
Resistance: 0.7541, 0.7550, 0.7576, 0.7596
GBPCAD
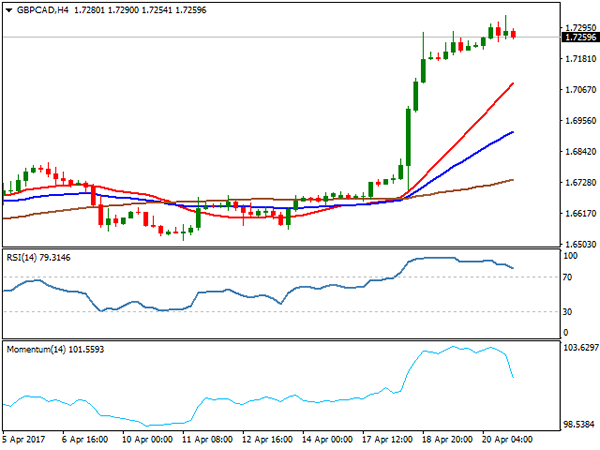
The GBPCAD cross maintains firm bullish tone and posted fresh high at 1.7340, the highest level since mid-September 2016. The pair continues to move higher despite strongly overbought daily studies, which are lacking to produce any firmer bearish signal. However, correction should be anticipated before the pair attacks next target at 1.7436 (50% retracement of Jun/Oct 2016 1.9127/1.5745 descend.
Daily candles with long upper wicks could be seen as initial signal of strong rally running out of steam.
Initial supports lay at 1.7215/1.7176, with 1.7024/00 zone expected to ideally contain correction.
Support: 1.7215, 1.7176, 1.7145, 1.7100
Resistance: 1.7340, 1.7436, 1.7524, 1.7542
GOLD
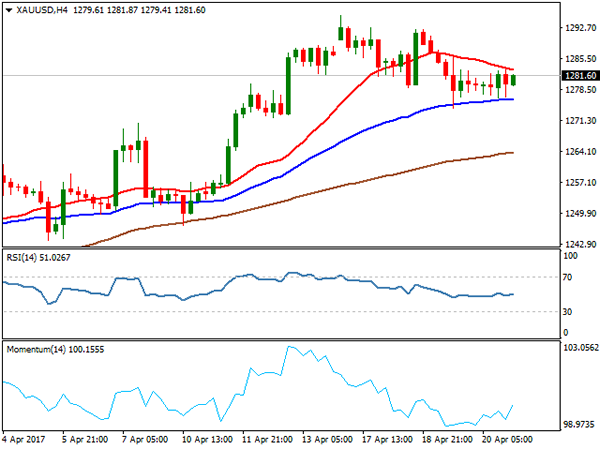
Spot Gold recovered part of losses of the previous day on Thursday, recovering from correction low at $1274, after pullback was contained by Fibonacci 38.2% retracement of $1243/$1295 upleg. The yellow metal bounced after the biggest one-day drop since Mar 30, after weaker than expected US jobs and manufacturing data released on Thursday, dented the tone of strengthening of US economy. Gold is also eyeing French election on Sunday, which may boost its existing safe haven appeal, built on recent uncertainty on rising geopolitical tensions that triggered strong risk-off mode among the traders.
From technical point of view, overall structure remains firmly bullish, with corrective easing on overbought studies seen preceding fresh upside actions.
Technical studies on lower timeframes are mixed and suggest prolonged consolidation phase. Thursday’s recovery was capped by thin hourly cloud (spanned between $1281 & $1283), break above which would gain fresh bullish momentum for further retracement of $1295/$1274 bear-leg and expose pivots at $1287 (Fibonacci 61.8%) and lower top at $1292.
Conversely, weakness below $1274 and violation of next pivot at $1271 (daily Tenkan-sen) would weaken near-term structure and risk stronger correction.
Support: 1276, 1274, 1275, 1271
Resistance: 1283, 1287, 1292, 1295
WTI CRUDE OIL
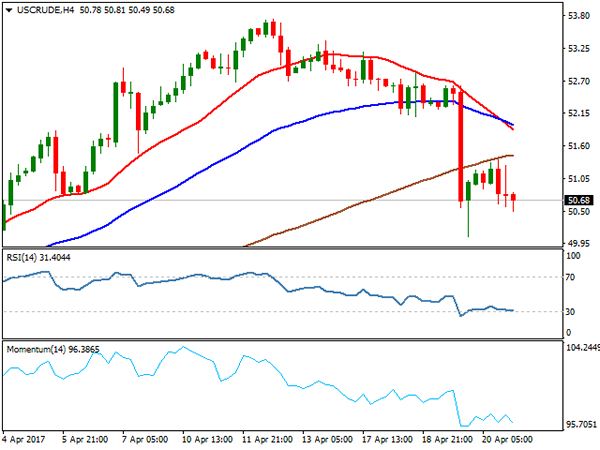
WTI oil remained in red on Thursday but managed to hold above Wednesday’s spike low at $50.06, as concerns over rising U.S. oil production offset bullish comments from oil producers on a possible extension to the OPEC-led deal to cut global supply. Oil price moved in and out of positive territory in volatile Thursday’s trading, but settled lower, despite bullish comments from OPEC members Saudi Arabia and Kuwait concerning a possible extension to the OPEC-led deal to cut global supply.
Technical studies remain negatively aligned and keep downside at risk, as price approached cracked Kijun-sen support at $50.40 and see risk of renewed attack at psychological $50.00 support, as the price closed below thickening daily Ichimoku cloud, which is seen as negative signal.
Support: 50.40, 50.00, 49.62, 48.92
Resistance: 51.36, 51.54, 51.84, 51.90
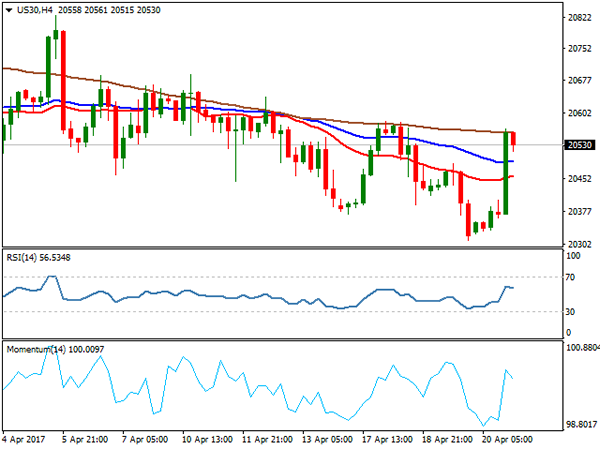
DJIA
Dow Jones bounced on Thursday and made strong bullish close after two days in red. The price found footstep at at 20310 and returned back into thick daily cloud after closing below cloud base on Wednesday, signalling false break lower.
Wall Street was higher on Thursday, led by a sharp rally in the shares of American Express , after the company posted better than expected earnings, as comments of US Treasury secretary Mnuchin on tax reform lifted sentiment.
Fresh rally on Thursday improved Dow’ s near-term sentiment, as Thursday’s rally marks the biggest one-day gains since Mar 1 and rally also cracked significant resistance at 20500 (daily Tenkan-sen). Recovery needs to regain next pivots at 20580 and 20669 (daily Kijun-sen) to expose daily Ichimoku cloud top at 20757 and signal stronger recovery on break.
On the downside, daily cloud base is expected to hold and maintain fresh bullish sentiment.
Support: 20500, 20385, 20310, 20211
Resistance: 20567, 20580, 20669, 20757
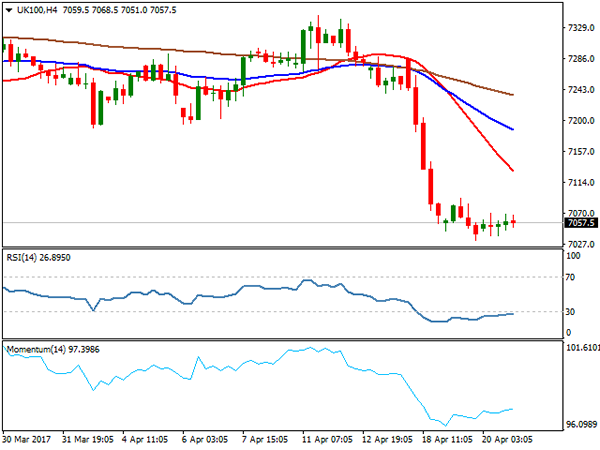
FTSE100
FTSE index is holding in narrowing consolidation for the second day, following strong fall on Tuesday, which so far found footstep at 7032. Firm bearish setup on daily technical studies keeps the downside in focus, as strong bearish sentiment remains in play on firm pound.
The price is looking for test of psychological 7000 support, break of which will open way towards next pivotal support at 6969 (Fibonacci 61.8% retracement of larger 6675/7444 rally.
Recovery attempts were limited for now and capped at 7092 (Fibonacci 23.6% of 7285/7032 fall) keeping intact more significant barriers at 7129 (Fibonacci 38.2%) and 7147 (broken 100SMA) which guard upper triggers at 7189/97 (daily Tenkan-sen / Ichimoku cloud base).
Support: 7032, 7024, 7000, 6969
Resistance: 7070, 7092, 7144, 7192
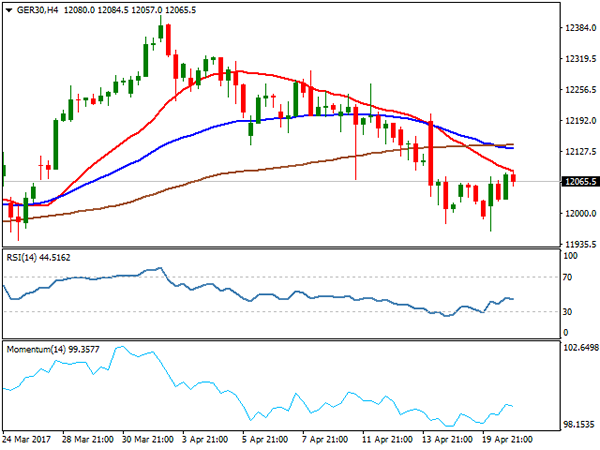
DAX
DAX ended Thursday’s trading positively, after spiking lower to 11962, but repeated probe below 12000 handle was short-lived and contained by rising 55SMA. Index was dragged higher by improved sentiment and Wall St rally and bounced back to broken Fibonacci 61.8% support at 12081, which capped the rally on Thursday.
Daily studies remain weak, but oversold conditions suggest extended correction, as daily indicators are turning up.
We look for recovery extension to 12133 (Fibonacci 38.2% of 12410/11962 pullback) which is expected to ideally cap, as barrier is reinforced by bearish-cross of daily Tenkan-sen / Kijun-sen lines.
Only sustained break above the latter would improve the structure and signal further recovery.
Support: 12026, 11962, 11943, 11878
Resistance: 12081, 12133, 12144, 12220