The bearish sentiment that began late January has guided the GBP/JPY currency pair lower towards the September 2017 low level at 143.16. This mark –8.47% decrease in price during the last six months.
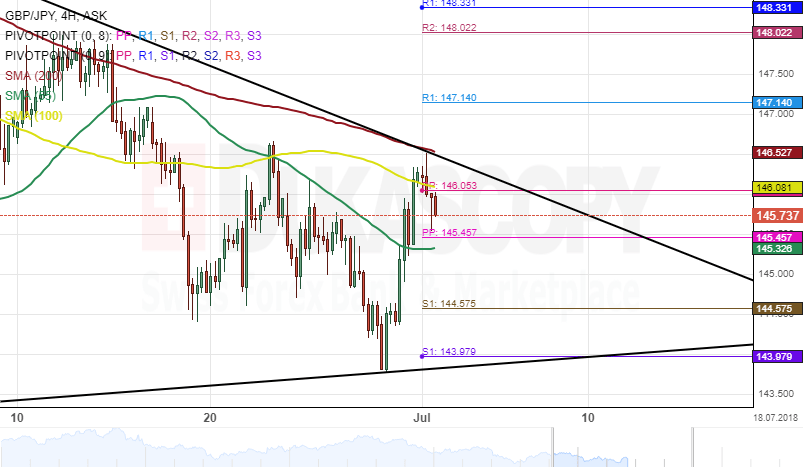
The 200-hour simple moving average has directed the exchange rate further south during the past few weeks. At the time of this analysis, the pair was stranded between SMAs. The 200-hour moving average was providing resistance at 146.54 while the 55-hour SMA was providing support.
In the meantime, technical indicators favour bears to continue controlling the market within this session. Meanwhile, a breakout could be expected from the SMAs within the next trading hours.