
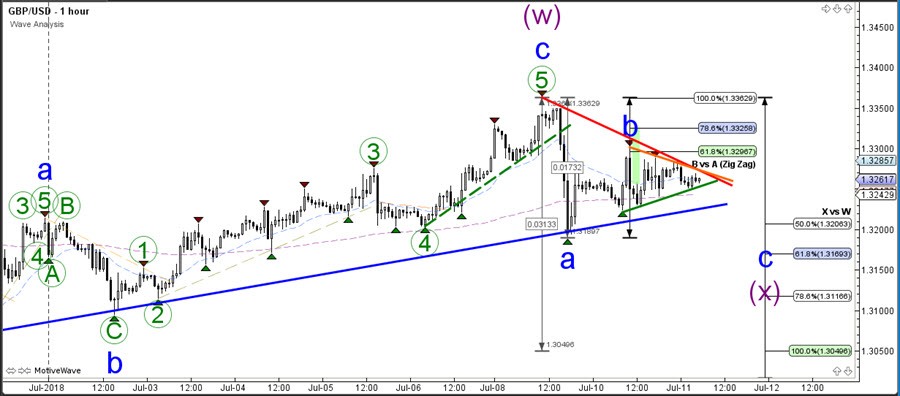
The GBP/USD is building a mini triangle pattern after making a bullish correction back to the resistance trend line of the bearish channel (red).
A bullish breakout could indicate a larger bullish correction towards the 38.2% Fibonacci level whereas a bearish break is probably part of a wave X (purple) which is part of larger WXY correction in wave 2 (pink).
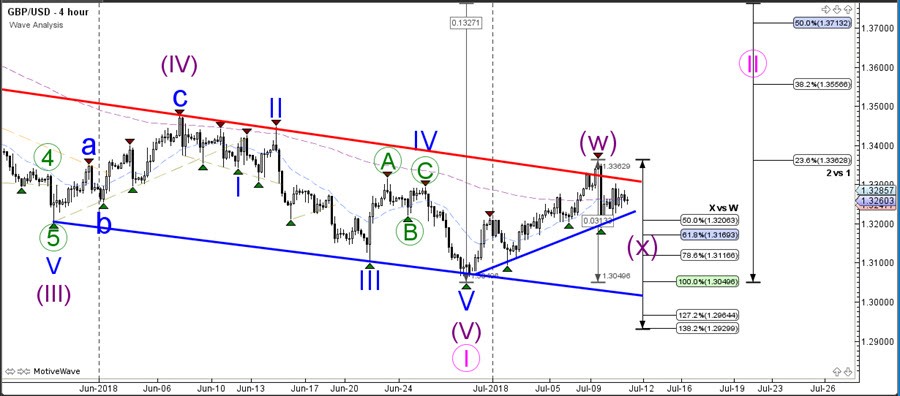
The GBP/USD is building a triangle chart pattern and the breakout above or below S&R lines is key for the immediate expected price movement. A bearish breakout however could find support at the Fib levels of wave X vs W.


