EUR/USD
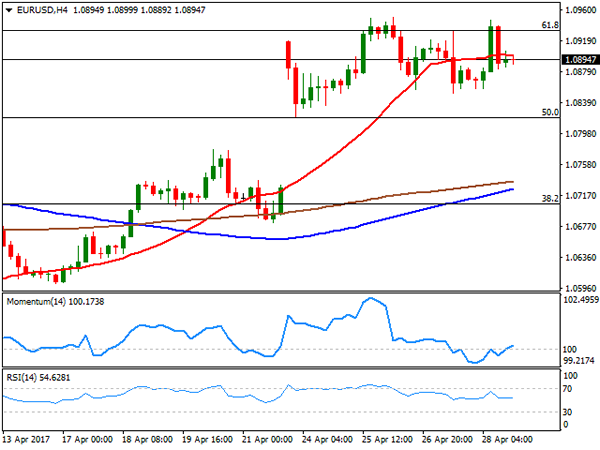
The American dollar closed the week mixed, only up against commodity-related currencies and with the EUR/USD pair having set a fresh 2017 high of 1.0950, amid diminishing political concerns in the region, after the first round of French elections. The pair pulled back on Friday, probably due to profit taking at the last day of the month, but the macroeconomic ground favors a continuation rally of the common currency, given that, while US data remain soft, with the economy growing just 0.7% in the three months to March, European inflation surprised to the upside, up to over three-year highs. Core annual inflation jumped to 1.2%, while the headline reading came in at 1.9%. The figures bring back to the table the possibility of tapering in the EU, despite the latest ECB’s statement indicated that tapering has not been discussed this month, as the bank sees inflation still subdued.
Trading during the first half of the week will likely be choppy, with Japan on its Golden Week and Europe on holiday on Monday due to Labor day in most of the world. Additionally, the US Fed’s meeting will take place this week, while next Friday, the country will release its monthly employment figures.
As for the technical outlook, the daily chart shows that the pair was unable to surpass a major long term resistance, the 61.8% retracement of the post-US election decline around 1.0930. Nevertheless, the bullish stance persists as the price stands above all of its moving averages, whilst technical indicators remain near overbought readings, with the RSI heading north around 65, and the Momentum fading modestly amid the lack of follow-through beyond the weekly high, rather than indicating diminishing buying interest. Shorter term, the 4 hours chart presents a neutral stance, as the price hovers around a horizontal 20 SMA, while technical indicators settled around their mid-lines. The pair will remain in consolidative mode as long as it holds within 1.0820 and 1.0950, with a clear break of any of such extremes setting the tone for the upcoming sessions.
Support levels: 1.0855 1.0820 1.0785
Resistance levels: 1.0910 1.0950 1.1000
USD/JPY
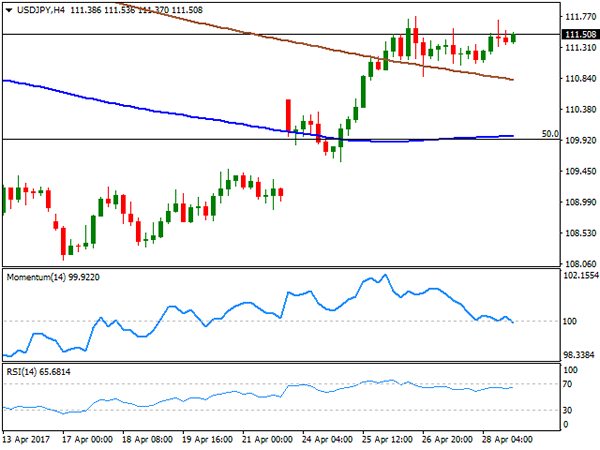
The USD/JPY pair closed its second consecutive week with gains, setting an April high of 111.77, but limited to the upside as falling US Treasury yields kept yen’s losses in check. The yield on the 10-year Treasury note fell to 2.28% in the last day of the month, accumulating 11.4 basis points to the downside in April, the largest one month decline since last October. Also, a neutral BOJ, positive on growth, but downgrading its inflation forecast for the ongoing fiscal year, failed to motivate investors around the JPY, while tepid US growth and confidence figures released on Friday contained the upside. Not only US preliminary Q1 GDP came in at 0.7%, but also the Michigan consumer confidence index fell to 97 in April from 98 in March. Upcoming direction will likely depend on how the market reacts to the Fed’s monetary policy outcome next Wednesday, with a bullish breakout expected in the case policymakers "confirm" a rate hike for next June. Technically, the daily chart shows that the price has settled above is 200 DMA, but also that the 100 DMA heads modestly lower around 112.70, the level to surpass to confirm a more sustainable recovery. In the same chart, the Momentum indicator heads sharply higher within positive territory, whilst the RSI indicator also advances around 59, all of which supports additional gains. In the 4 hours chart, the price is also above its moving averages that anyway maintain their bearish slopes, the RSI indicator hovers around 65, but the Momentum heads south around its 100 level, indicating diminishing buying interest around the pair.
Support levels: 110.95 110.60 110.20
Resistance levels: 111.75 112.10 112.45
GBP/USD
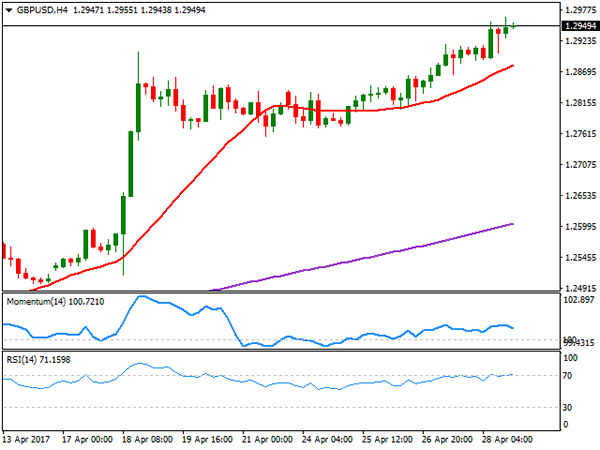
The Pound managed to extend its rally to a fresh 7-month high of 1.2964 against its American rival, despite a weak UK Q1 GDP reading. The economy in the kingdom grew by just 0.3% according to preliminary estimates, hurt by the sharp advance in inflation triggered by the Brexit decision. Minor figures were released all through the week, still indicating some degree of resilience, although starting to dent confidence in the future developments. The pair closed the week at 1.2950, with market players eyeing the major psychological barrier at 1.3000, where large buying interest is expected to surge, at least on a first attempt of breaking higher. The pair retains its bullish technical stance according to the daily chart, as the price advanced far above its moving averages, whilst the RSI indicator heads north around 74 and the Momentum indicator consolidates near overbought readings. Still, unless the 1.3000 region is clearly broken, caution is recommended at current levels. According to the 4 hours chart, the risk is also towards the upside, as the 20 SMA maintains its bullish slope, currently around 1.2880, while technical indicators have partially lows upward strength, but hold near overbought levels.
Support levels: 1.2880 1.2830 1.2795
Resistance levels: 1.2965 1.3010 1.3060
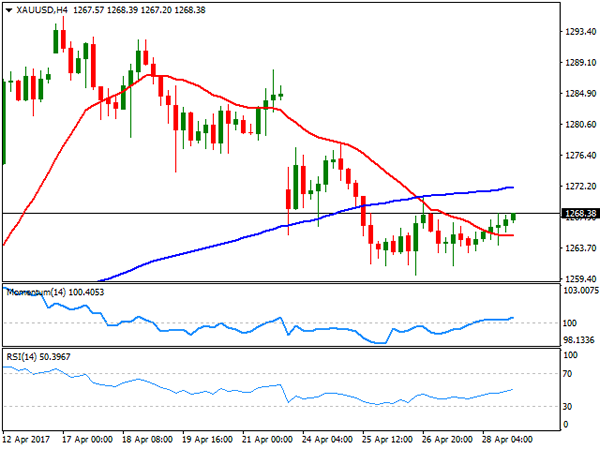
GOLD
Gold prices edged lower for a second consecutive week, with spot closing the week at $1,268.38 a troy ounce. The decline took place at the beginning of the week, as the outcome of the first round of the French presidential election spurred demand for high-yielding assets, in detriment of safe-haven hold. However, the commodity spent the rest of the week in consolidative mode, as investors turned cautious ahead of clearer signs of easing political woes, and limited demand for the US currency. The FOMC monetary policy decision is on tap this week, and while the Central Bank is largely expected to remain on hold, investors will be looking for clues on what’s next to take directional positions. Daily basis, the price settled below its 20 DMA for the first time since mid March, while technical indicators retreated towards their mid-lines, supporting some additional declines, particularly on a break below 1,259.99, the weekly low. In the 4 hours chart, technical indicators present a limited upward potential, heading higher within neutral territory, whilst the price is now above a flat 20 SMA, but below its 100 SMA, this last at 1,272.05, providing a strong dynamic resistance.
Support levels: 1,259.90 1,250.70 1,242.50
Resistance levels: 1,272.05 1,278.10 1,288.20
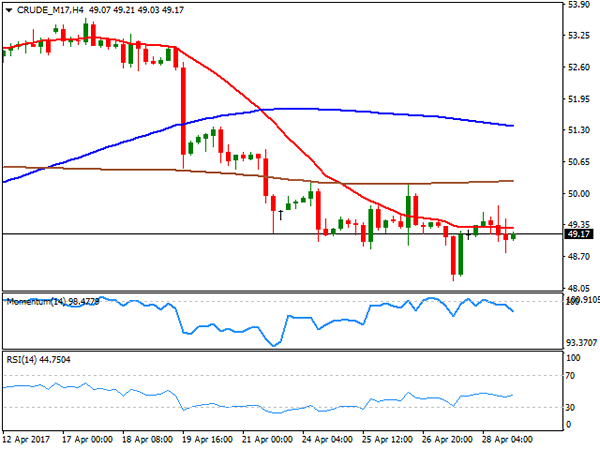
WTI CRUDE OIL
West Texas Intermediate crude oil futures settled at $49.17 a barrel, down for a second consecutive week, undermined over renewed concerns of persistent worldwide glut. The commodity fell to a weekly low of 48.21 on Thursday, following news that two key Libyan pipelines resumed producing around 400,000 barrels a day after protests blocking them,ended. Adding to the sour tone was US production, currently at 9.27 million bpd, the highest in nearly two years. Also, the Baker Hughes report released on Friday showed that the number of active oil rigs in the country surged to 697 up for 15th consecutive week. The daily chart for the commodity show that the price remains below all of its moving averages, with selling interest aligned around the 200 DMA, currently at 50.20, whilst technical indicators eased their bearish strength, but hold near oversold territory. In the 4 hours chart, the price settled below a flat 20 SMA, while technical indicators hold within bearish territory, with limited downward strength.
Support levels: 48.85 48.20 47.70
Resistance levels: 49.60 50.20 50.75
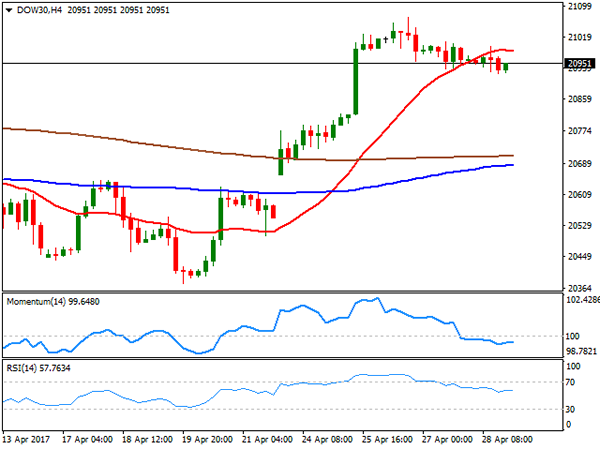
DJIA
US indexes closed lower on Friday, although with strong gains weekly basis. The Dow Jones Industrial Average shed 40 points on Friday, and closed at 20,940.51, whilst the S&P lost 4 points, to 2,384.20. The Nasdaq Composite closed the day 1 point lower at 6,047.61 after peaking at a fresh all time high during the day. Within the Dow Chevron was the best performer, up 1.17%, followed by Cisco Systems which added 0.95%. Intel led decliners, shedding 3.42%, whilst Verizon Communications lost 1.63%. Technically, the daily chart for the index showed that the index hold near record highs, but also that it lacks upward momentum, as it’s holding above horizontal moving averages, whilst technical indicators began to easy modestly within positive territory. In the shorter term, and according to the 4 hours chart the benchmark is at risk of correcting further lower, as the 20 SMA lost its upward strength and turned flat, now offering a dynamic resistance at 20,982,, whilst the Momentum indicator turned flat within negative territory as the RSI indicator consolidates around 57.
Support levels: 20,923 20,869 20,819
Resistance levels: 20,982 21,035 21,071
FTSE100
US indexes closed lower on Friday, although with strong gains weekly basis. The Dow Jones Industrial Average shed 40 points on Friday, and closed at 20,940.51, whilst the S&P lost 4 points, to 2,384.20. The Nasdaq Composite closed the day 1 point lower at 6,047.61 after peaking at a fresh all time high during the day. Within the Dow Chevron was the best performer, up 1.17%, followed by Cisco Systems which added 0.95%. Intel led decliners, shedding 3.42%, whilst Verizon Communications lost 1.63%. Technically, the daily chart for the index showed that the index hold near record highs, but also that it lacks upward momentum, as it’s holding above horizontal moving averages, whilst technical indicators began to easy modestly within positive territory. In the shorter term, and according to the 4 hours chart the benchmark is at risk of correcting further lower, as the 20 SMA lost its upward strength and turned flat, now offering a dynamic resistance at 20,982,, whilst the Momentum indicator turned flat within negative territory as the RSI indicator consolidates around 57.
Support levels: 20,923 20,869 20,819
Resistance levels: 20,982 21,035 21,071
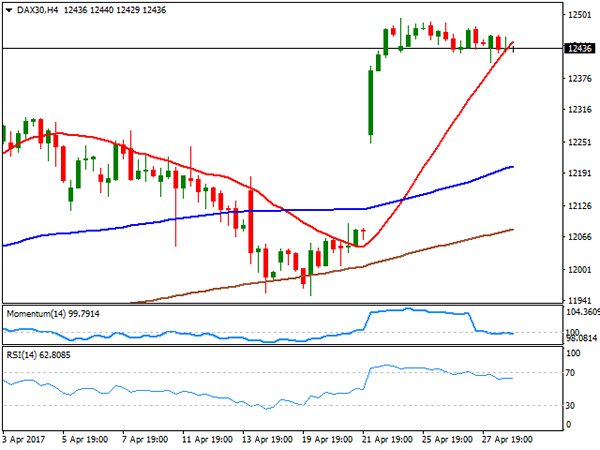
DAX
European equities traded lower on Friday, with the German DAX shedding 5 points to 12,438.01, as comments from US President Donald Trump on escalating tensions with North Korea weighed on investors’ sentiment. Nevertheless, the benchmark settled not far from the record high achieved this past week at 12,495 following the result Macron’s victory in France. On Friday, Commerzbank led advancers, adding 2.04%, followed by Linde which gained 1.63%. Losers, however, outpaced gainers, with Heidelberg Cement leading decliners with a 2.27% lost. The daily chart shows that the benchmark is within a consolidative phase, but also that the risk remains towards the upside as it holds well above healthy bullish moving averages, whilst indicators hold within positive territory. In the 4 hours chart, the technical outlook is neutral-to-bullish, as the index holds around a sharply bullish 20 SMA, the Momentum turned flat around its 100 level, while the RSI heads nowhere around 62.
Support levels: 12,405 12,366 12,312
Resistance levels: 12,458 12,495 12,530