AUD/NZD started appreciating since the beginning of April. The currency pair reversed from the lower boundary of a dominant descending channel on April 11 and a high mark of 1.1004 during the previous week trading sessions.
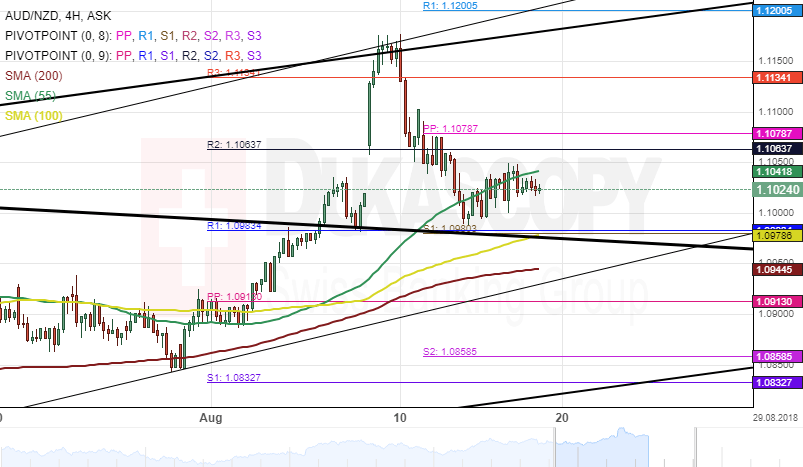
The exchange rate pullback from a seven-month high level on August 10 and began to depreciate. As a result, the currency pair breached some significant support level. Namely, the monthly, the weekly and the 55-hour simple moving average within this short period.
Technical indicators flash bullish signals on the daily time-frame. Therefore, it is likely that the currency exchange rate could reverse from a support cluster at 1.0983 during the following trading days.