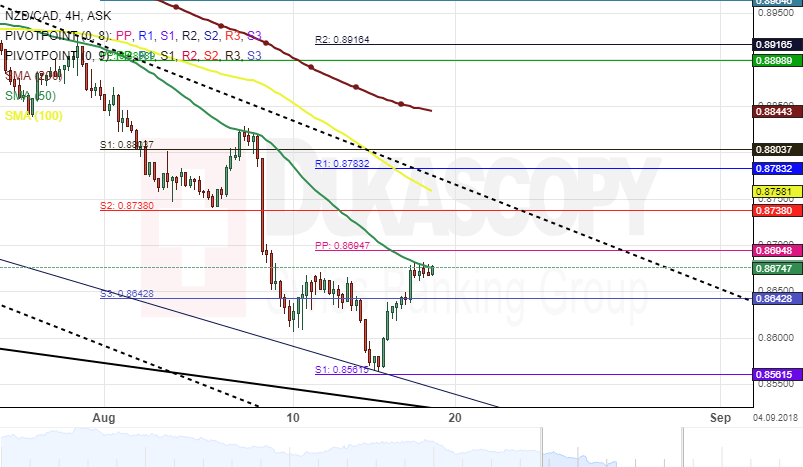
The NZD/CAD currency pair has been trading in several descending channels since the beginning of the year. The most important of the patterns is a downtrend line, which has guided the price lower.
After hitting a resistance level formed by the 55-hour simple moving average near 0.8827 on August 8, the exchange rate began to decline massively. As a result, the pair fell to the bottom border of a junior descending channel.
Technical indicators on both the smaller and the larger time frames demonstrate that the movement of the currency exchange rate is likely to continue its southern journey during the following trading sessions.