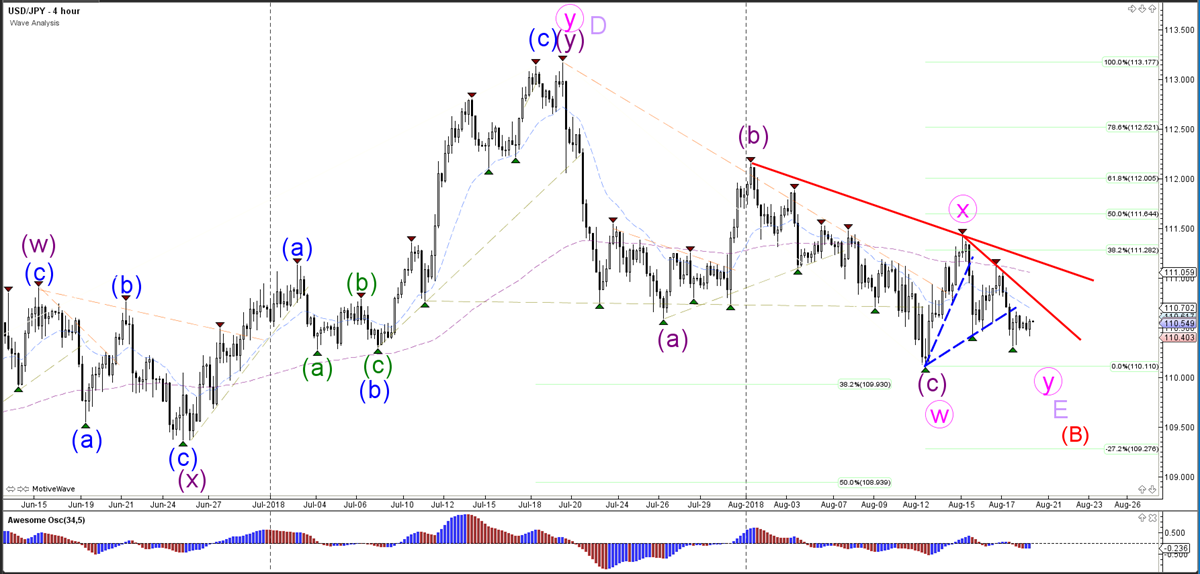
The USD/JPY broke the support trend lines (dotted blue) and could be moving lower as part of wave Y (pink) if the price manages to stay below the resistance (red) trend lines. A bearish continuation could be aiming for the -27.2% Fibonacci target.
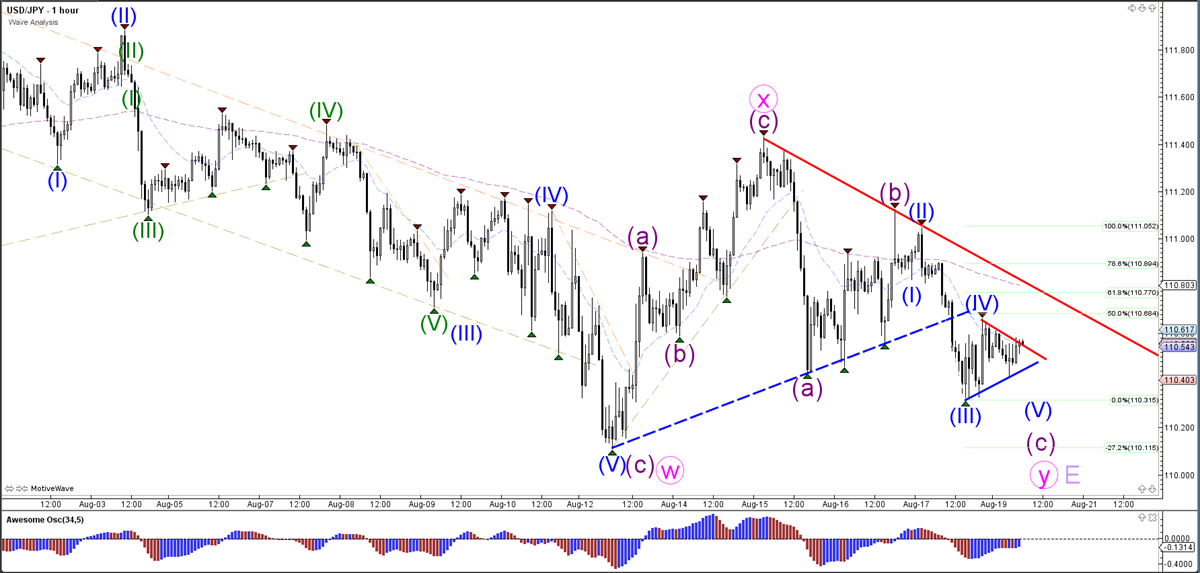
The USD/JPY is building a contracting triangle chart pattern. A break below the triangle could confirm the downtrend continuation, whereas a break above the triangle could indicate a deeper wave 4 (blue) correction. Price is likely to be in a wave 4 (blue) as long as the price stays below the 61.8% Fib.