
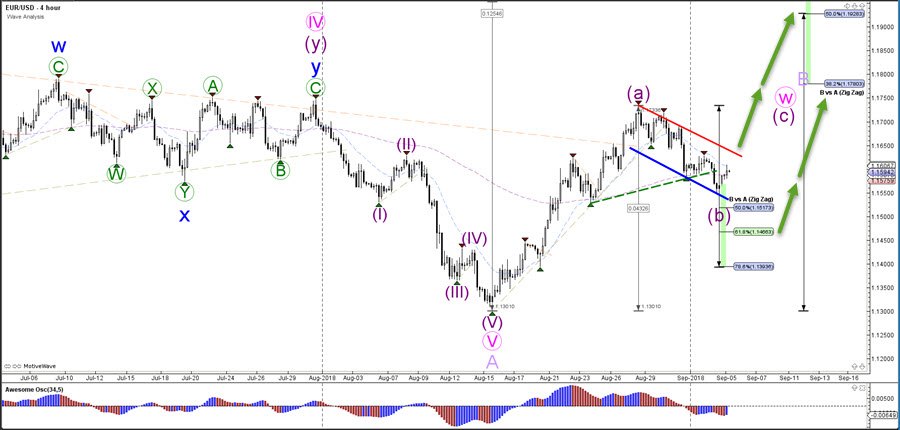
The EUR/USD seems to be building a larger bull flag chart pattern. A bullish breakout could see price move towards the Fibonacci targets of wave C.
The EUR/USD could be completing a larger ABC (purple) pattern, which becomes less likely to occur if price breaks below the 61.8% Fib of wave B vs A and is invalidated if price breaks below the bottom near 1.13. A bullish break above the resistance (red) line of the flag pattern could indicate a bullish continuation within wave C (purple).
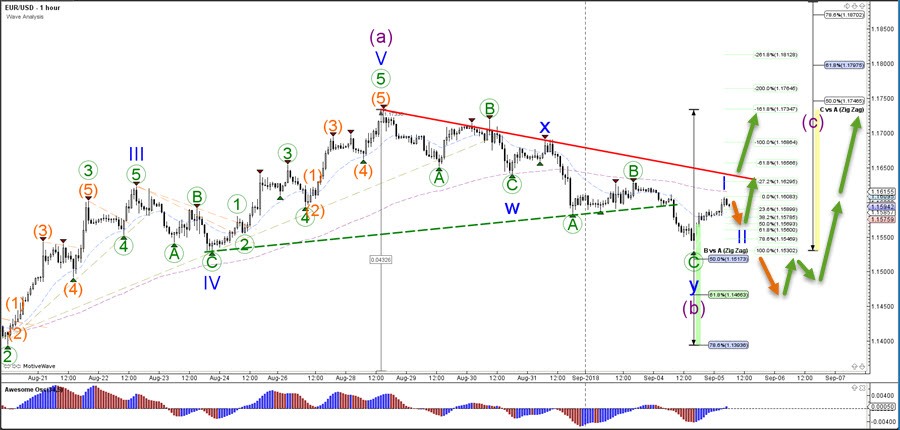
The EUR/USD could be building a wave 1-2 (blue) pattern within wave C (purple) if price stays above the 100% Fibonacci level. In that case, an ABC correction (green) has completed the wave B (purple). A break lower could indicate a fall towards the 61.8% Fibonacci retracement level, which is a new potential support level.


