
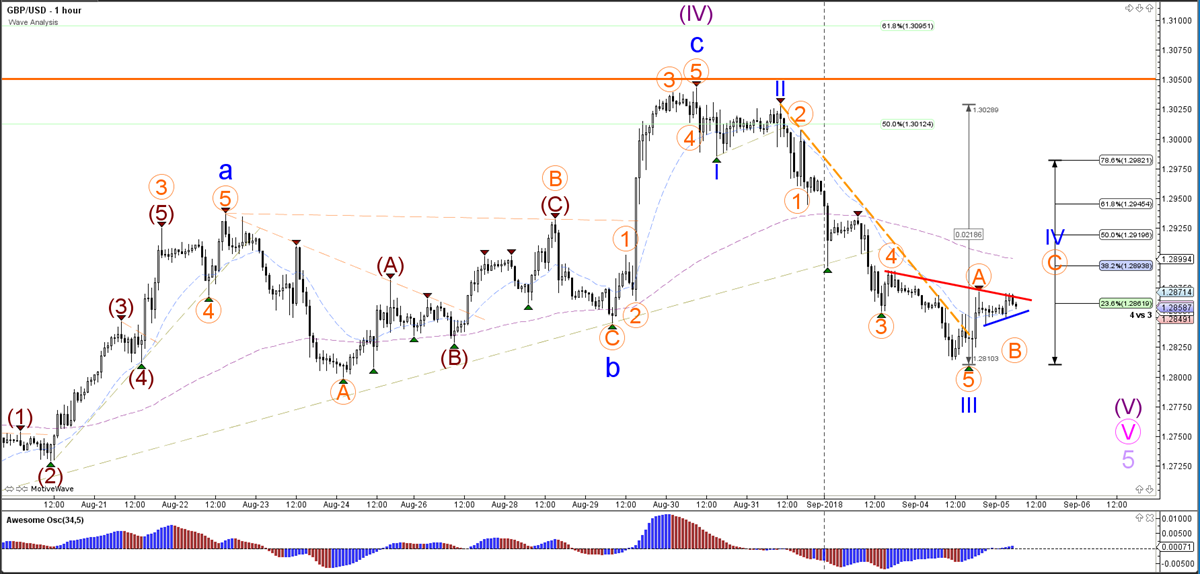
The GBP/USD is showing strong bearish momentum after completing an ABC zigzag within a wave 4 (purple) correction. The bearish breakout could indicate a restart of the downtrend within waves 5. Whether the price has completed a wave 3 (blue) or a wave 1 will depend on how the price reacts to the Fibonacci retracement levels of wave 4 vs 3 (see the 1 hour chart for more information).
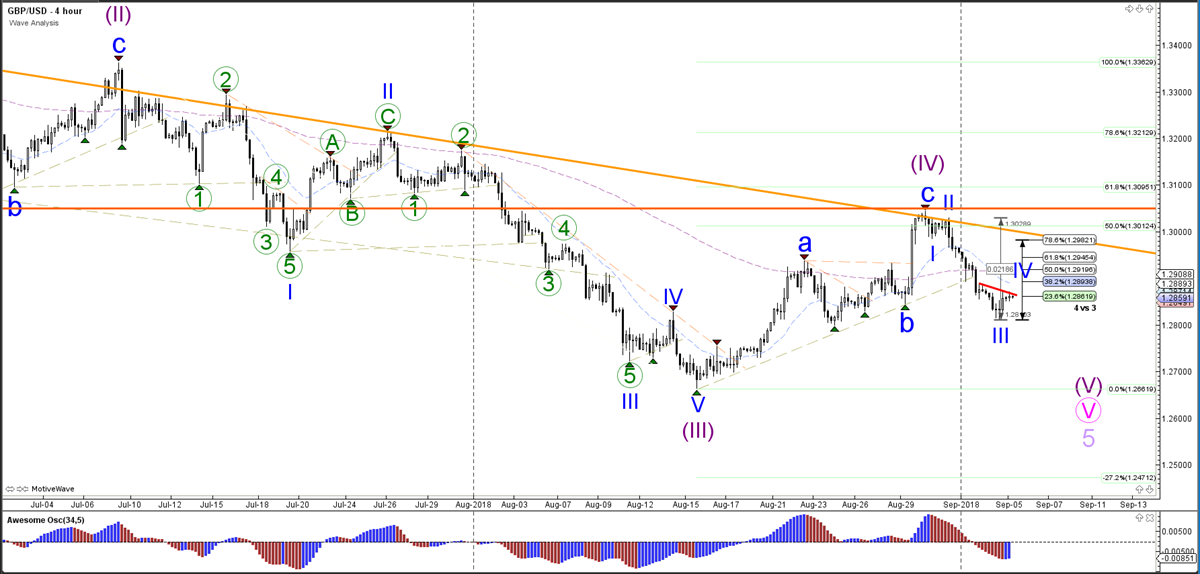
The GBP/USD could be building a wave 4 (blue) if the price stays below the 50% Fibonacci retracement level. A break above the 50% Fib could indicate a wave 1-2 pattern rather than a wave 3-4.


