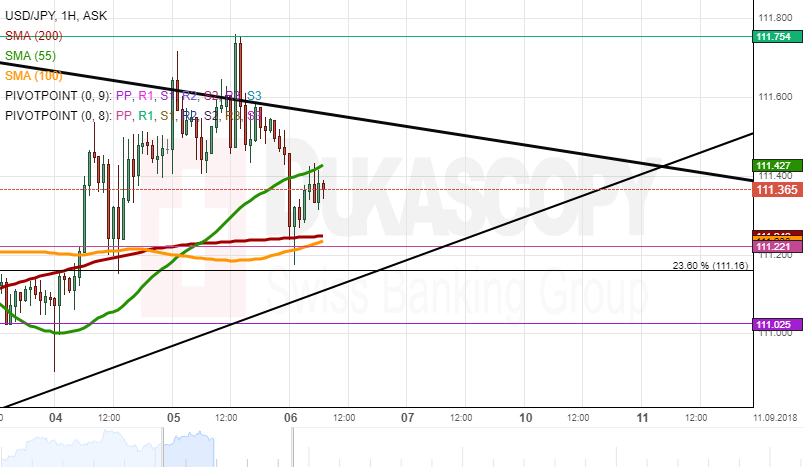
The USD/JPY gained additional ground previously by breaking the upper trend line of a dominant pattern. However, on Thursday it was back down below 111.40 level. The rate was located between the resistance of the 55-hour SMA at 111.40 and the 100 and 200-hour SMA’s during at 111.20.
The rate had begun to and was set to continue moving up. The reasons was the moving north of both the resistance and support simple moving averages.
The surge would reach and once more test the dominant trend line, which had been pierced previously. Watch the chart for a breaking or holding of the trend line.