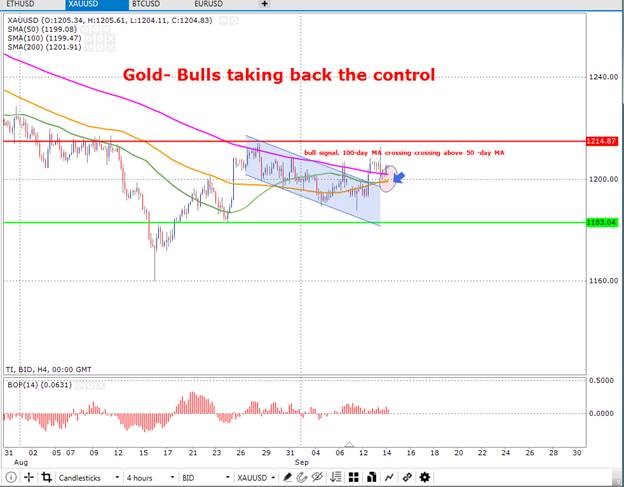
Gold – Bulls repossessing control
The chart below on an intra-day time frame (4 hours) shows gold trading in an uptrend. Moreover, the price is currently trading above all moving averages where additionally, it is displayed below that the 100-day moving average seems to be performing a cross over above the 50-day moving average which lets off a strong bullish signal. In result, this may allow the price to continue trading towards the resistance zone (colored in red) which is priced at $1214.87. On the other hand, if the price starts to decline where the bears take over, then the price may move in the direction of the support zone (shown in horizontal green line) which is priced at $1183.04.
The Balance of Power chart below confirms the bullish momentum which is present in the markets for gold. However, the chart shows a variety of highs and lows, but at present the price looks to be in bull territory. Nevertheless, this is not to say this will always be the case.
Major support: 1183.04
Major resistance: 1214.87
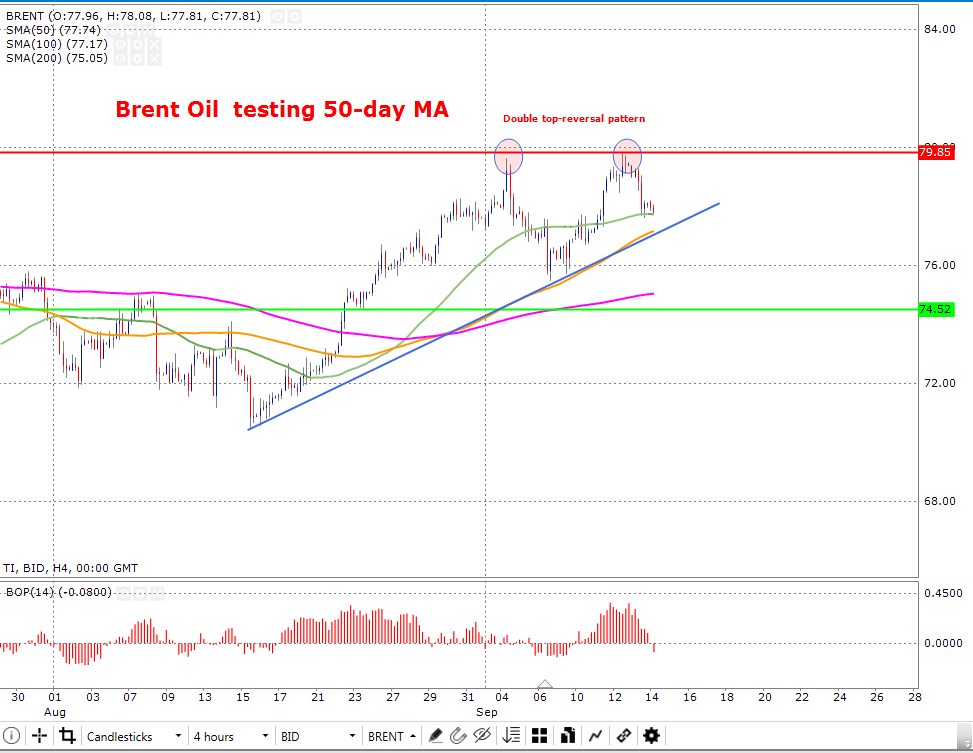
Brent oil – 50-day MA being testing
The chart below on an intra-day time frame (4 hours) shows Brent crude oil trading in an uptrend where the price is testing the 50-day (coloured in green) moving average. It is displayed that the price had encountered two double top reversal patterns which is clearly displayed in the chart as transparent circles. Moreover, this is most commonly known as a reversal pattern which informs a potential correction.
If the price experiences an increase in price, then oil may trade towards the resistance zone (shown in horizontal red line) which is priced at $79.85. In addition, this is where the two-previous double top reversal patters had taken place. On the other hand, if the price declines where a bearish momentum would be present, then the price may trade towards the support zone (shown in horizontal green line) which is priced at $74.52.
The Balance of Power chart below shows that the bears have gained strength and are currently in control. Nevertheless, it is also displayed that the bulls had a long win streak. However, dependent upon the outcome of the price testing the 50-day moving average shown below may determine which side of the markets will hold dominance.
Major support: 74.52
Major resistance: 79.85