EUR/USD
A stronger-than-expected US nonfarm Payroll report released on Friday failed to boost demand for the American currency, which closed the week mostly lower across the board. The US economy managed to add 211,000 new jobs in April, whilst the unemployment rate fell to 4.4% amid a decline in the participation rate to 62.9%. Wages were soft, up by 0.3% monthly basis as expected, and 2.5% year-on-year, below previous 2.7%. The figures were enough to keep the Fed in the tightening path, with odds of a June rate hike up to 90% after the report. Still, market’s attention quickly shifted to the upcoming developments in Europe, as this Sunday France will go back to the polls to define whether Macron or Le Pen is becoming the new president. Polls show a strong lead of the centrist candidate, and the market rushed to price in further political relief in the EU.
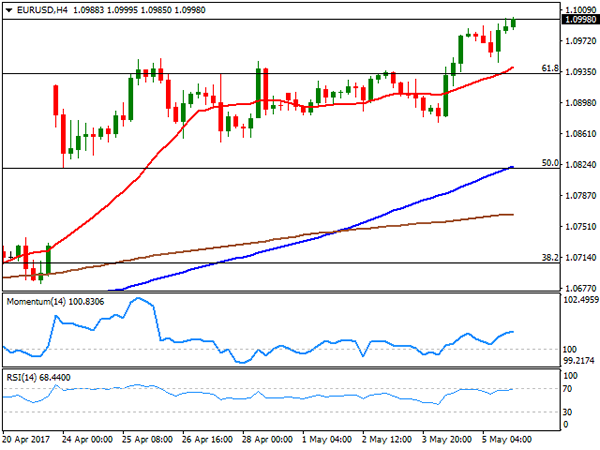
The EUR/USD pair flirted with 1.1000 at the weekly close, and chances of an upward gap, although smaller than the one seen a couple of weeks ago, are limited. A surprise victory of Le Pen, on the other hand, should trigger chaos across the board, with high-yielding currencies plunging even beyond pre-French election first round levels, and safe-haven yen soaring.
From a technical point of view, the pair is poised to extend its advance after breaking through the 1.0930/50 region, where the pair has the 61.8% retracement of the post-US election slump and former yearly highs. Daily basis, technical indicators have resumed their advances after a modest downward correction and stand near overbought territory, whilst the 20 SMA accelerated its advance after surpassing the larger ones, now at the mentioned 1.0930/50 region. Shorter term, the 4 hours chart shows that the 20 SMA is also heading north in the mentioned price zone, whilst technical indicators aim higher within positive territory.
Support levels:1.0950 1.0900 1.0855
Resistance levels: 1.1045 1.1080 1.1120
USD/JPY
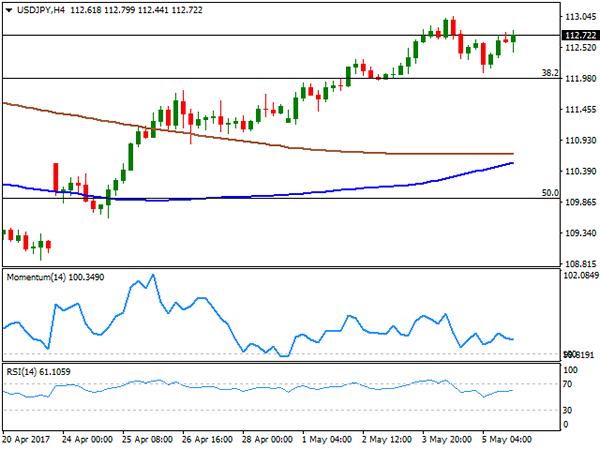
The USD/JPY pair closed with gains for a third consecutive week at 112.72, after setting a weekly high of 113.04 early Thursday, after the US Federal Reserve monetary policy meeting showed that policy makers were not concerned about Q1 data, considering it a transitory set back in the growing path. The yen edged marginally lower on Friday, supported by strong rallies in equities and a US Nonfarm Payroll report, although gains were limited by mute Treasury yields. The 10-year benchmark closed the week at 2.35%, retreating from previous 2.36%, while the 2-year yield ended unchanged at 1.31%. Japan will come back after the Golden Week holiday with April’s consumer confidence index this Monday, expected at 44.3 from previous 43.9. In the meantime the technical picture still favors the upside, given that in the daily chart, the price has settled a few pips above its 100 SMA for the first time since mid March, whilst the 200 DMA advances well below the shortest. The Momentum indicator in the mentioned time frame eased modestly within overbought territory, but the RSI indicator holds ground around 65. In the 4 hours chart, technical indicators are horizontal within positive territory, whilst the price develops far above its moving averages, overall indicating limited upward strength at the time being. An upward acceleration beyond 113.00 is now required to confirm a new leg higher that can extend up to 114.40, a major static resistance this week.
Support levels: 112.45 112.00 111.60
Resistance levels: 113.00 113.30 113.70
GBP/USD
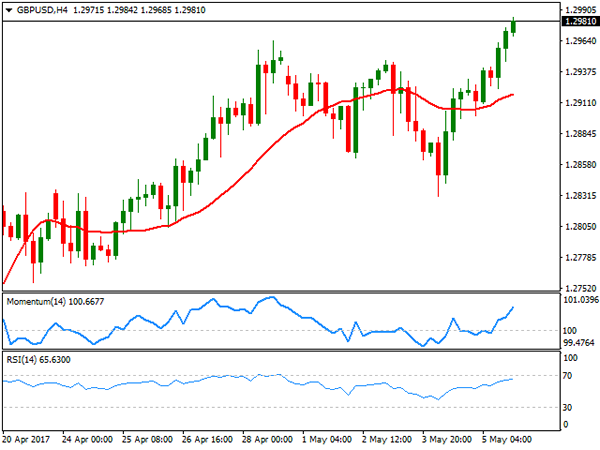
The GBP/USD pair closed the week at 1.2981, its highest since September last year, as strong UK data released all through the week offset rough preliminary Brexit talks. The PMIs all strengthened above expected in April, indicating that the economy remains strong. Also PM Theresa May called for early parliamentary elections a couple of weeks ago, a wise move that will give her legal popular backup, ahead of the official talks. The daily chart for the pair shows that the Momentum indicator bounced modestly from its 100 level as the price surpassed the top of its recent range, while the RSI indicator also resumed its advance and stands near overbought territory. The pair bottomed at 1.2830 this past week, near a sharply bullish 20 DMA that is now reinforcing the static support area. Shorter term, and according to the 4 hours chart, the price advanced above a still directionless 20 SMA, this last around 1.2920, while technical the Momentum indicator regained its upward strength, reaching fresh 2-week highs, and also leaning the scale towards the upside.
Support levels: 1.2965 1.2920 1.2880
Resistance levels: 1.3010 1.3060 1.3100
GOLD
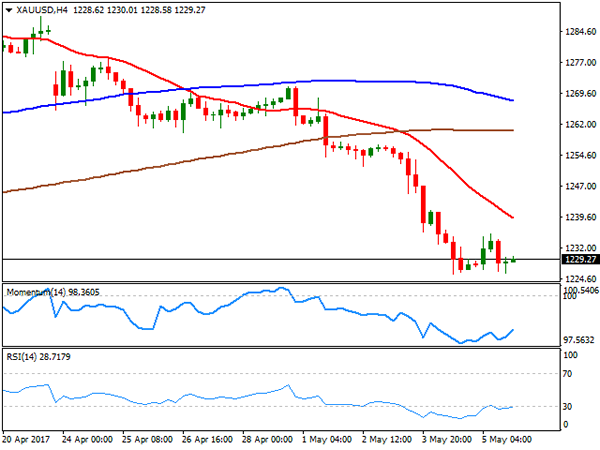
Gold prices plummeted this past week, with spot settling at $1,229.27 a troy ounce, is lowest since mid March. The bright metal suffered the worst week for this year, as the US Federal Reserve confirmed its view on local growth, while a solid employment creation in April supported the case for a June hike. Another factor weighing on the commodity is easing political concerns in the EU. Gold has fallen as low as $1,225.66 this week, and from a technical point of view, the risk remains towards the downside, given that in the daily chart, the price fell below its 100 and 200 DMAs, both converging around 1,234.40, from where the commodity retreated on an attempt to advance last Friday. In the same chart, technical indicators have lost bearish strength near oversold readings, but remain nearby, with no signs of changing route. Shorter term, and according to the 4 hours chart, technical indicators hold within oversold territory, while the 20 SMA heads sharply lower well above the current level, in line with further slides particularly on a break below the mentioned low.
Support levels: 1,225.60 1,214.10 1,203.80
Resistance levels: 1,234.40 1,242.50 1,250.90
WTI CRUDE OIL
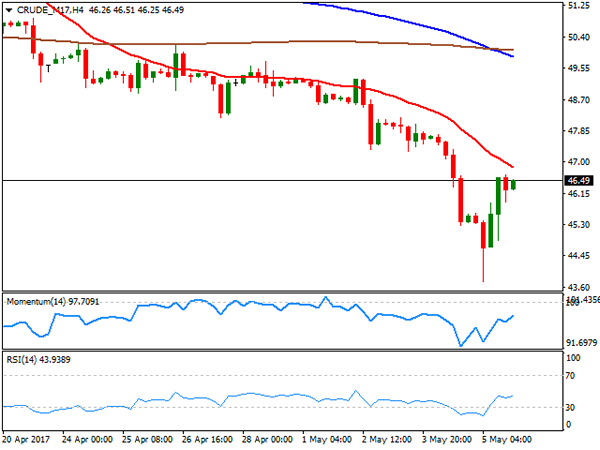
West Texas Intermediate crude oil futures plunged to $43.75 a barrel early Friday, but managed to bounce back afterwards, ending the week anyway in the red at 46.49. There was not a certain catalyst beyond the early decline, although sentiment towards the commodity is generally negative, dented by increasing US production that offset OPEC efforts to deal with the worldwide glut. The Baker Hughes report released on Friday showed that the number of active rigs drilling oil in the US climbed to 703, up for 16th consecutive week. Despite the bounce, WTI closed at levels last seen on December 2016 and the daily chart shows that technical indicators have managed to bounce some, but are still within oversold readings, whilst the price is far below all of its moving averages, maintaining the risk towards the downside. In the 4 hours chart, a strongly bearish 20 SMA caps the upside around 47.10, while technical indicators have managed to correct extreme oversold readings, but remain well below their mid-lines, in line with the longer term perspective.
Support levels: 45.90 45.30 43.70
Resistance levels: 47.10 47.75 48.50
DJIA
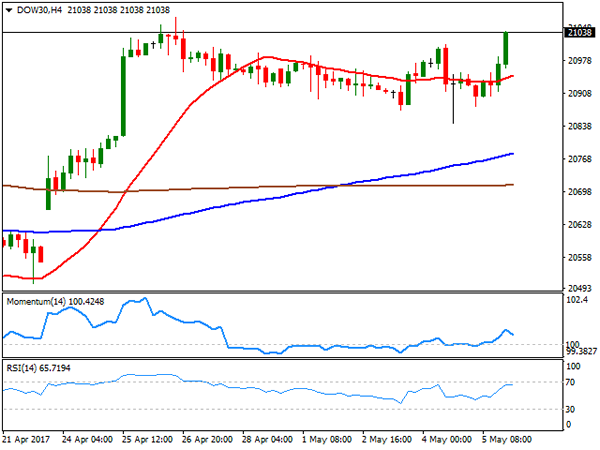
US major indexes advanced on Friday, closing their third consecutive week with gains, backed by a bounce in oil prices and a solid job’s creation in April following March´s disappointment. The Dow Jones Industrial Average advanced 55 points and closed at 21,006.94, while the Nasdaq Composite added 0.42%, to 6,100.76. The S&P closed at record highs after adding 0.41%, helped by a strong advance in the energy sector, ending the week at 2,399.29. Within the Dow, El du Point led advancers, adding 2.98%, followed by Verizon Communications that gained 1.77%. IBM was the worst performer shedding 2.51%, followed by Nike that closed 0.95% lower. Daily basis, the DJIA settled at the upper end of its last three-week range, and seems poised to extend its advance, given that technical indicators in the mentioned time frame turned sharply higher within positive territory, as the index keeps developing above its moving averages. In the 4 hours chart, technical indicators lost upward strength and turned marginally lower within positive territory, but the index holds around its daily high and above bullish moving averages, also supporting further gains, particularly on a break above 21,071, April monthly high.
Support levels: 20,986 20,939 20,898
Resistance levels: 21,071 21,138 21,180
FTSE100
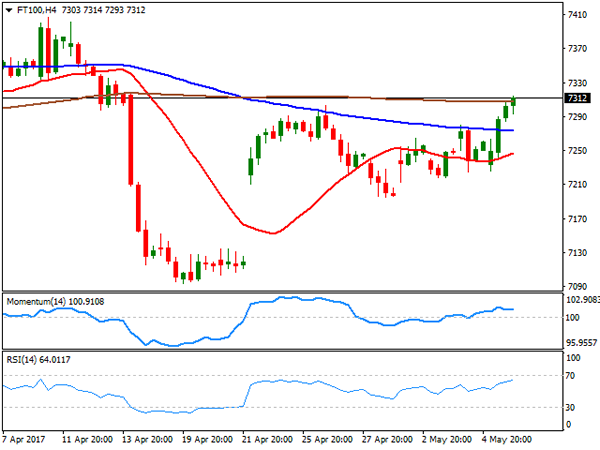
The FTSE 100 ended the week at 7,297.43, up 49 points or 0.68% on Friday, backed by another batch of strong earnings reports. Pearson was the best performer, adding 12.39% after launching a "strategic review" and announcing plans to cut costs by £300m a year by the end of 2019. International Consolidated Airlines added 5.51% after announcing that underlying operating profit rose by 9.7%. ITV was the worst performer, ending the day down 2.61%, followed by Barclays that shed 2.60%. The index hovers around a three-week high ahead of the weekly opening, gaining upward potential, as in the daily chart, it recovered strongly above a 100 DMA after hovering around it for most of the past week, also breaking above its 20 DMA for the first time in nearly a month. Technical indicators in the mentioned chart head north around their mid-lines, not yet confirming a sustainable recovery. Shorter term, and according to the 4 hours chart, the risk is also towards the upside, although additional confirmations are required, as indicators hold flat above their mid-lines whilst the index settled a few points above a horizontal 200 SMA.
Support levels: 7,284 7,247 7,200
Resistance levels: 7,332 7,385 7,439
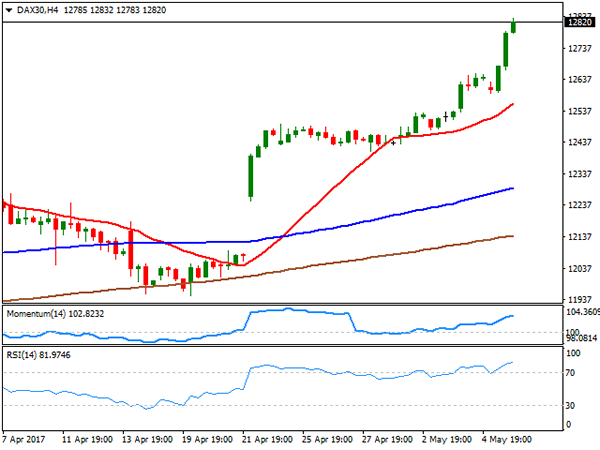
DAX
The German DAX advanced 69 points or 0.55% on Friday, to close at 12,716.89, a fresh record high. The benchmark was supported by strong local data released all through the week, rallying further amid easing political concerns in the region, as the market has pretty much fully priced in a Macron’s victory in France spooking fears of rising populism in Europe. Only three components closed in the red, with E.ON down 1.16%, followed by ProSiebenSat.1 Med that shed 0.40%. Deutsche Bank on the other hand was the best performer, up 2.78%, followed by Linde that added 2.65%. Trading at historical levels, the daily chart shows that technical indicators retain their bullish slopes, despite being in extreme overbought levels, whilst the index is far above its moving averages. In the 4 hours chart, indicators are also heading higher within overbought levels, and the index above its moving averages, with further gains expected on a break above 12,832 on a Macron’s confirmed victory.
Support levels: 12,789 12,720 12,668
Resistance levels: 12,832 12,880 12,940