
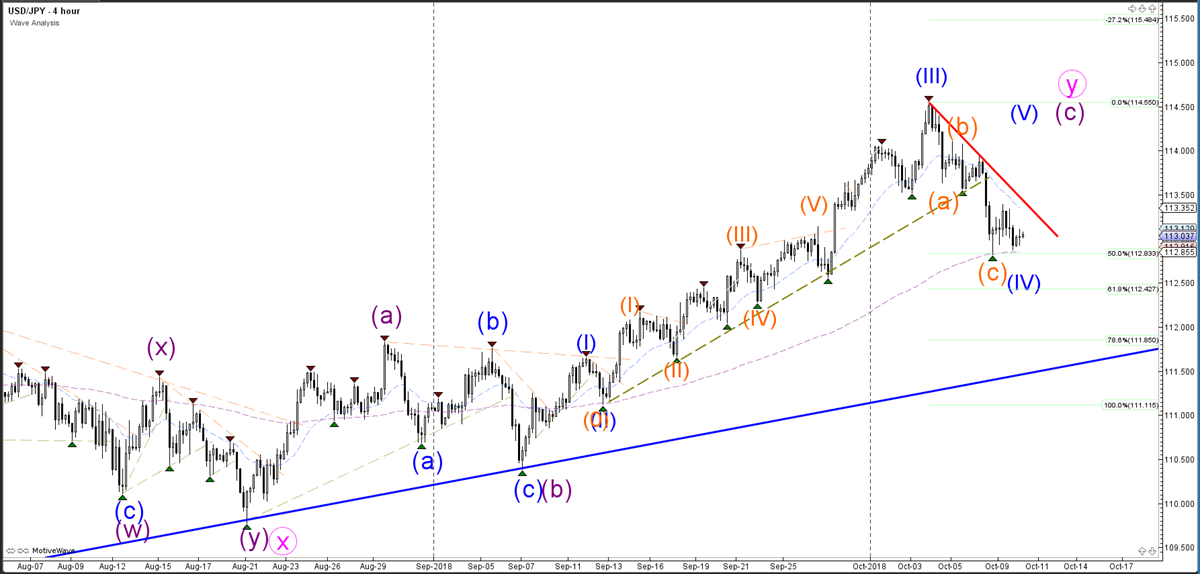
The USD/JPY currency pair is testing a key support level and decision zone. The 50% Fibonacci retracement level at 112.83 is a critical bounce or break spot for the wave 4 pattern (blue). A bearish break could see the price test another key support zone at 112.50, but a break below that could indicate a downtrend. A bullish breakout above the resistance trend line (red) could indicate an uptrend continuation.
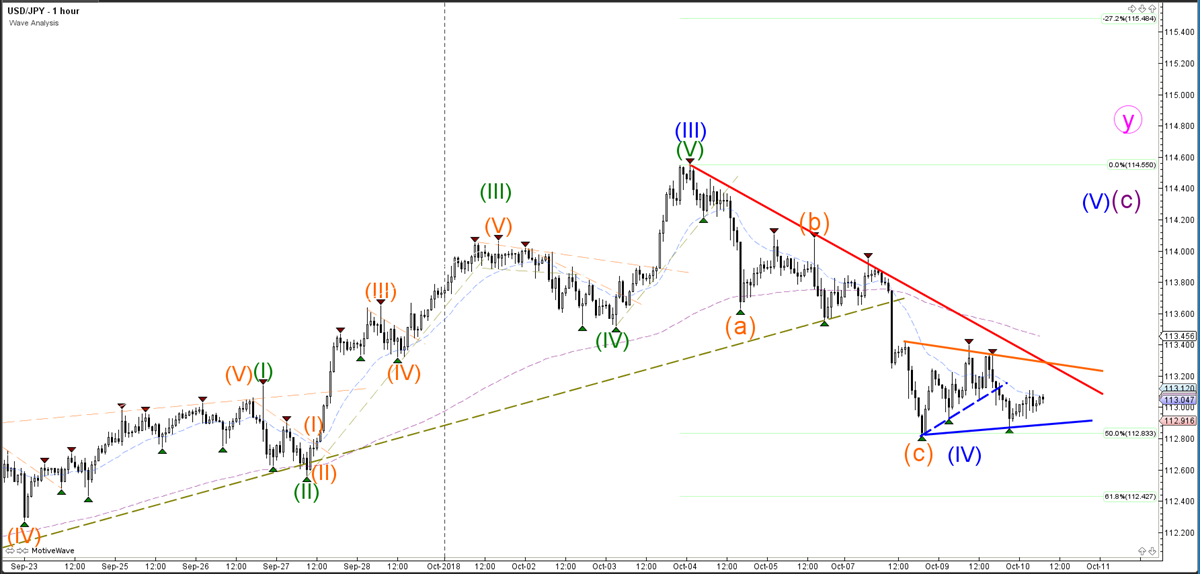
The USD/JPY is building a triangle pattern, and the breakout direction will depend on candlestick patterns that push through support (blue) or resistance (red), and whether the price has a better chance of moving higher or lower.
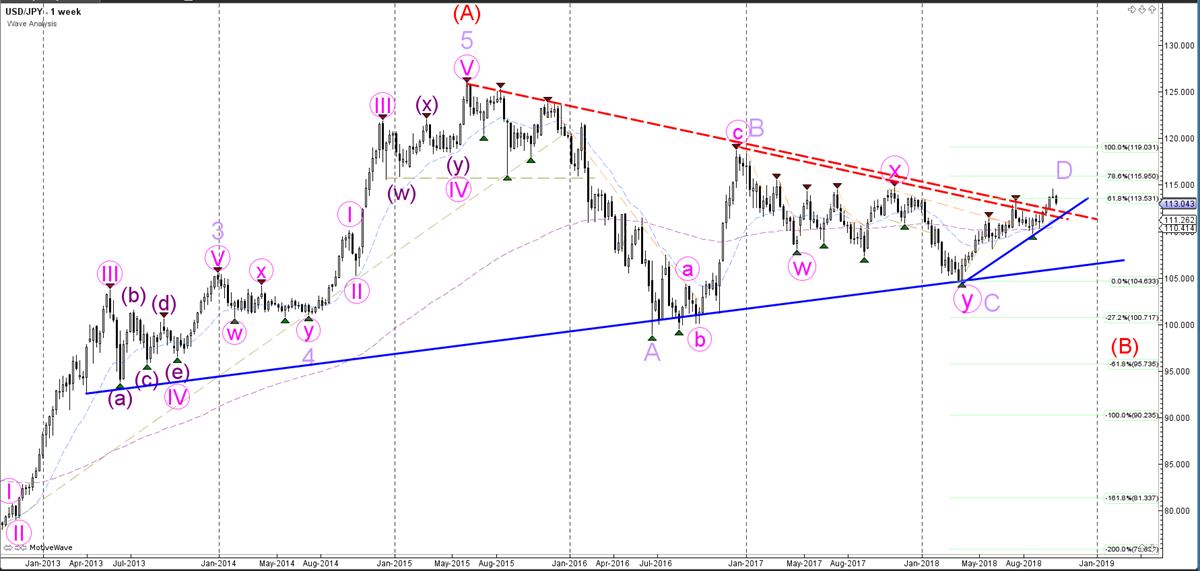
The USD/JPY currency pair broke above the resistance trend lines (dotted red), but the breakout might be limited due to the potential triangle chart pattern that is taking place via the ABCD (purple) within wave B (red). The price could bounce at the Fibonacci levels if the price is indeed building a triangle pattern.


