
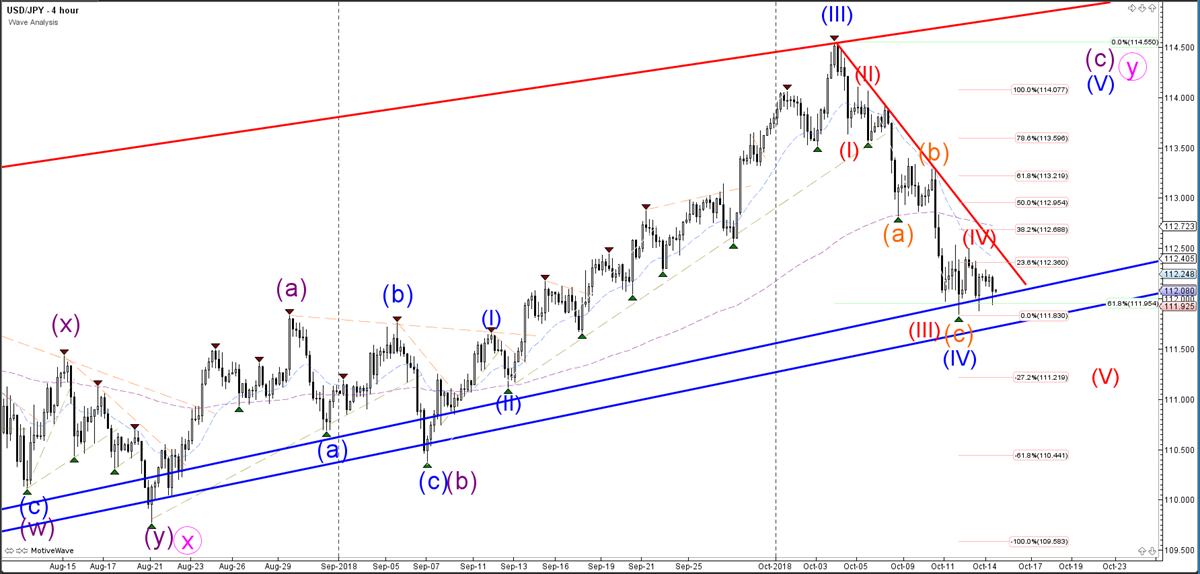
The USD/JPY currency pair made a bearish bounce at the 23.6% Fibonacci retracement level, which could be part of a wave 4 (red) pattern and the start of the wave 5 (red). A bullish break however, indicates that the price is still in a bullish wave 4-5 (blue) pattern.
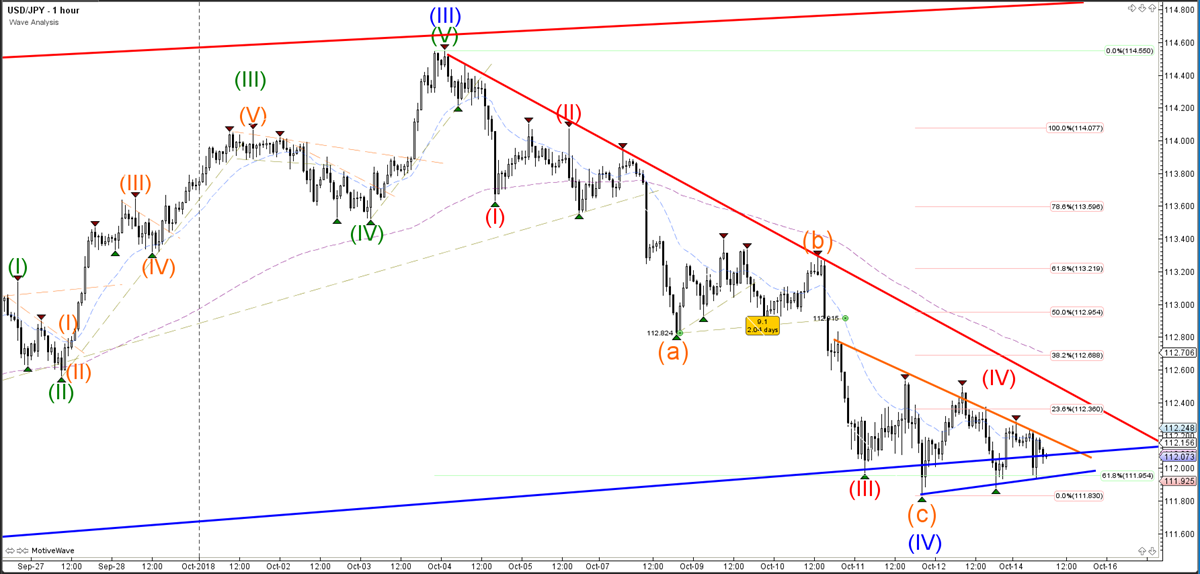
The USD/JPY currency pair is testing key support trend lines (blue), and the price is expected to make a bounce or break, which will depend on the candlestick patterns that appear.
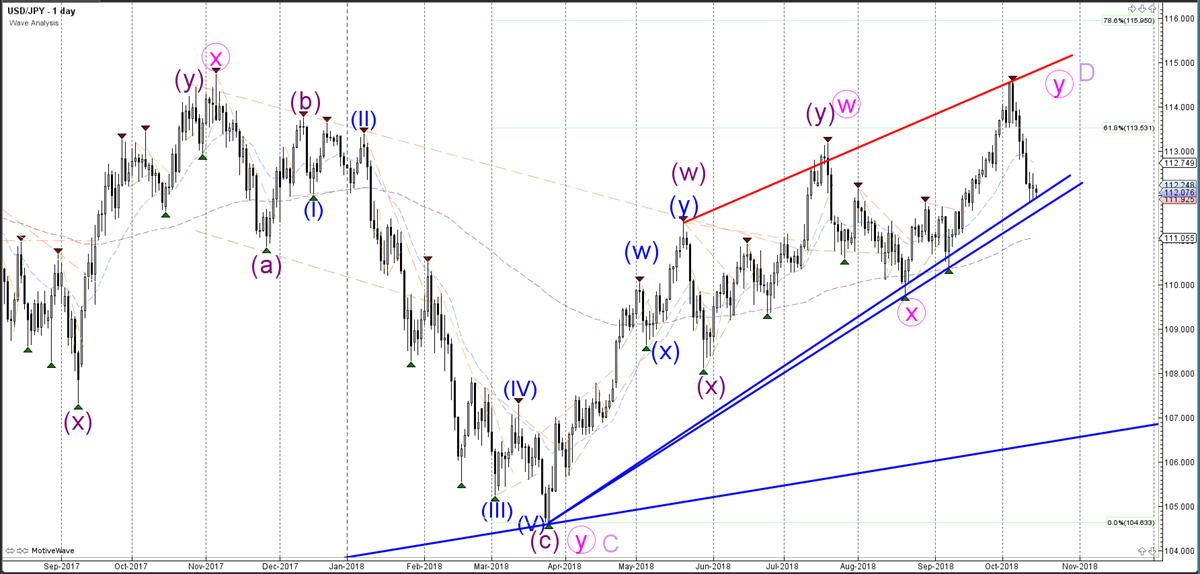
The USD/JPY currency pair has completed the wave Y (pink) of wave D (purple), if the price manages to break below support. A bounce at the support indicates a potential bullish continuation.


