
Key Highlights
- The US Dollar found support near 111.65 and recovered nicely against the Japanese Yen.
- There was a break above a crucial bearish trend line with resistance at 112.20 on the 4-hours chart of USD/JPY.
- The US Initial Jobless Claims figure for the week ending Oct 13, 2018 declined from the last revised reading of 215K to 210K.
- Today, the US Existing Home Sales for Sep 2018 will be released, which is forecasted to increase 1.8% (MoM).
USDJPY Technical Analysis
After a major decline, the US Dollar found support near the 111.65 level against the Japanese Yen. The USD/JPY pair started a decent recovery and moved above the 112.00 resistance.
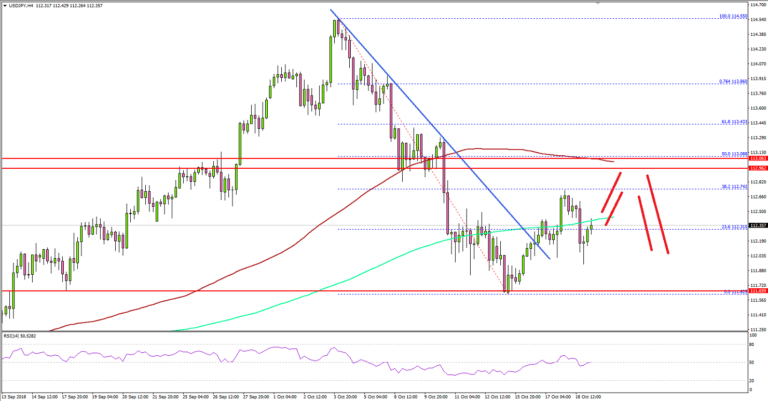
Looking at the 4-hours chart, the pair likely completed a bearish wave near the 111.60-70 zone. A low was formed at 111.63 and the pair traded above the 23.6% Fib retracement level of the last decline from the 114.55 high to 111.63 low.
More importantly, the pair broke a crucial bearish trend line with resistance at 112.20. Besides, there was a break above the 112.50 resistance and the 200 simple moving average (green, 4-hours).
The pair is currently placed nicely above the 112.00 and 112.20 support levels. To the topside, there is a significant resistance near the 113.00-113.10 zone, which was a support earlier.
The 50% Fib retracement level of the last decline from the 114.55 high to 111.63 low is also at 113.08 to act as a resistance. Therefore, if the pair continues to move higher, it could face sellers near 113.00 or 113.10. Above these resistances, the price may well climb towards the 114.00 level.
On the downside, if there is a close below the 112.20 level and the 200 SMA, there could be a bearish extension towards the 111.00 level.
Fundamentally, the US Initial Jobless Claims figure for the week ending Oct 13, 2018 was released by the US Department of Labor. The market was looking for a decline from 214K to 212K.
The actual result was better as there was a decline in claims to 210K. However, the last reading was revised from 214K to 215K.
The report added:
The 4-week moving average was 211,750, an increase of 2,000 from the previous week’s revised average. The previous week’s average was revised up by 250 from 209,500 to 209,750.
Looking at major pairs, both EUR/USD and GBP/USD are currently trading in a bearish zone, and it seems like the greenback may continue to gain traction in the near term.
Economic Releases to Watch Today
- Canadian Retail Sales August 2018 (MoM) – Forecast +0.4%, versus +0.3% previous.
- Canadian Retail Sales ex Autos August 2018 (MoM) – Forecast -0.2%, versus +0.9% previous.
- Canadian Consumer Price Index Sep 2018 (MoM) – Forecast -0.1%, versus -0.1% previous.
- Canadian Consumer Price Index Sep 2018 (YoY) – Forecast +2.9%, versus +2.8% previous.
- US Existing Home Sales for Sep 2018 (MoM) – Forecast +1.8%, versus 0% previous.


