
The EUR/USD currency pair
Technical indicators of the currency pair:
Prev Open: 1.14058
Open: 1.13861
% chg. over the last day: -0.19
Day’s range: 1.13774 – 1.13996
52 wk range: 1.1299 – 1.2557
On Friday, November 2, trading on currency majors was very active. The US have published a rather optimistic report on the labor market for October. The dollar index (#DX) closed in the positive zone (+0.27%). Demand for the US currency is still high. At the moment, the EUR/USD quotes are consolidating in the range of 1.13750-1.14000. We recommend opening positions from these marks.
The news feed on 05.11.2018:
At 17:00 (GMT+2:00) the ISM non-manufacturing PMI will be published.
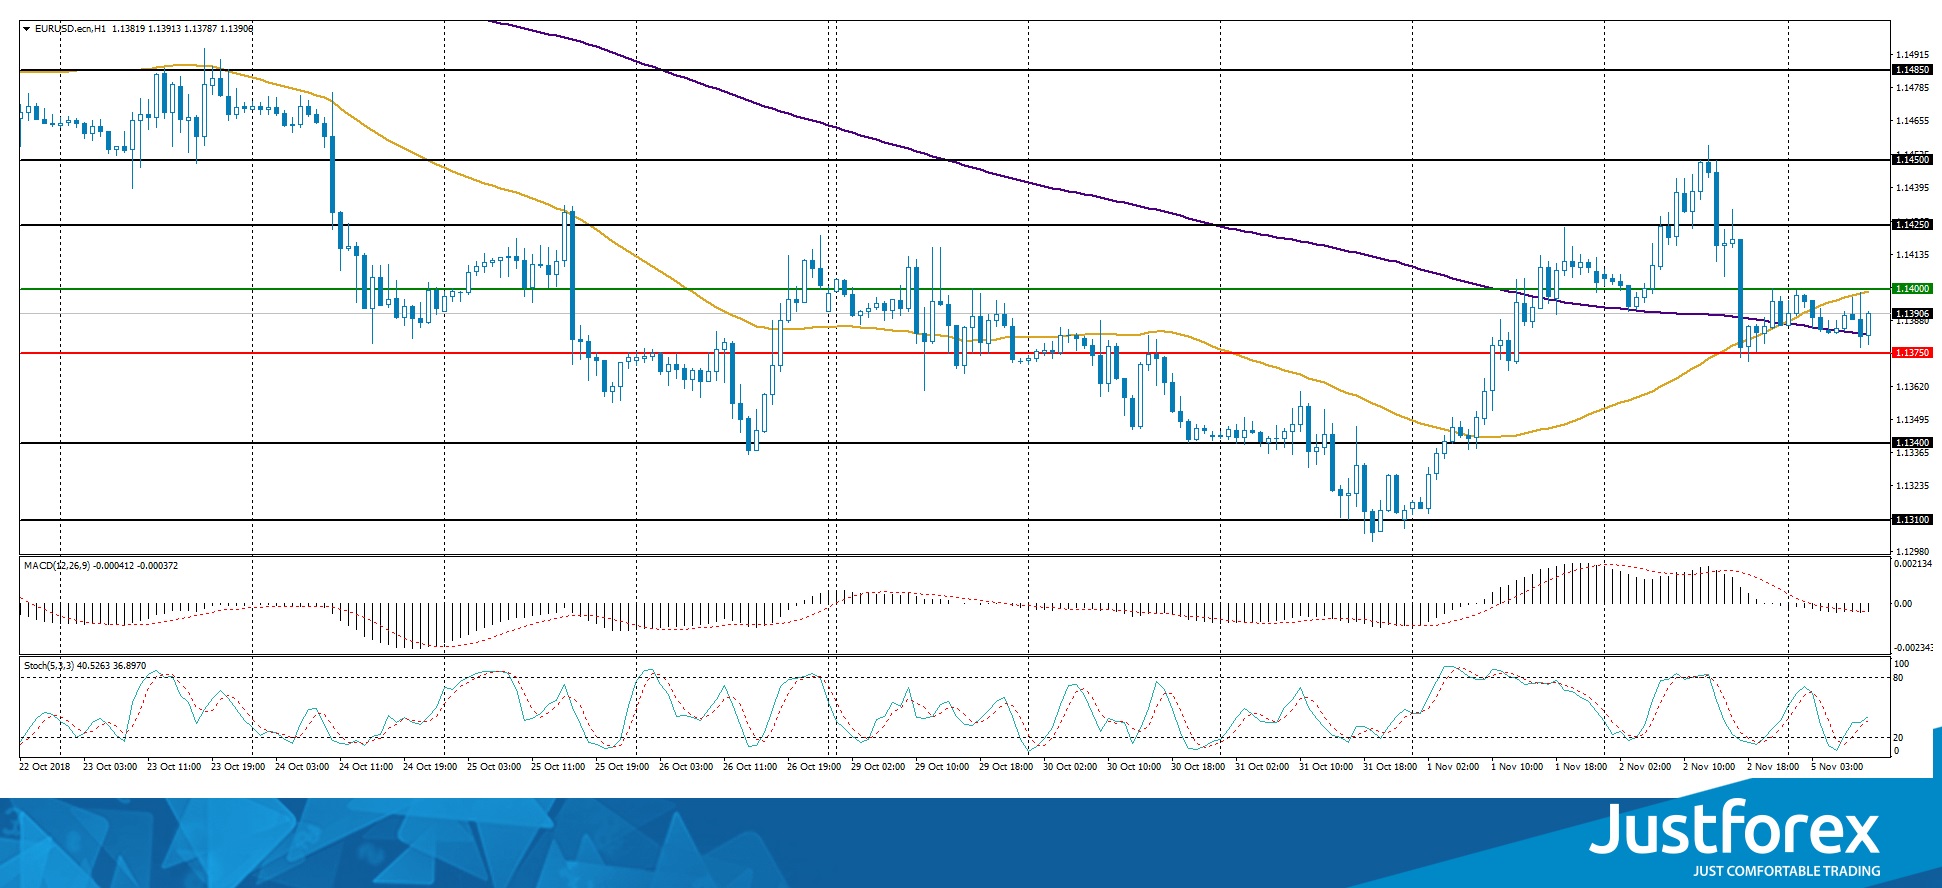
Indicators do not send accurate signals: the price has crossed 50 MA and 200 MA.
The MACD histogram is close to the 0 mark.
Stochastic Oscillator is in the neutral zone, the %K line is above the %D line, which indicates the bullish sentiment.
Trading recommendations
Support levels: 1.13750, 1.13400, 1.13100
Resistance levels: 1.14000, 1.14250, 1.14500
If the price fixes above the round level of 1.14000, the EUR/USD quotes are expected to grow. The movement is tending to 1.14250-1.14500.
Alternative option. If the price fixes below 1.13750, it is necessary to look for entry points to the market to open short positions. The movement is tending to 1.13400-1.13100.
The GBP/USD currency pair
Technical indicators of the currency pair:
Prev Open: 1.29981
Open: 1.30215
% chg. over the last day: -0.29
Day’s range: 1.29835 – 1.30247
52 wk range: 1.2662 – 1.4378
The GBP/USD currency pair is in a sideways trend after a sharp rise last week. At the moment, quotes are testing local support and resistance levels: 1.29800 and 1.30300, respectively. The trading instrument has the potential for further growth. We recommend following the current information regarding the Brexit process.
At 11:30 (GMT+2:00) the index of economic activity in the UK services sector will be published.
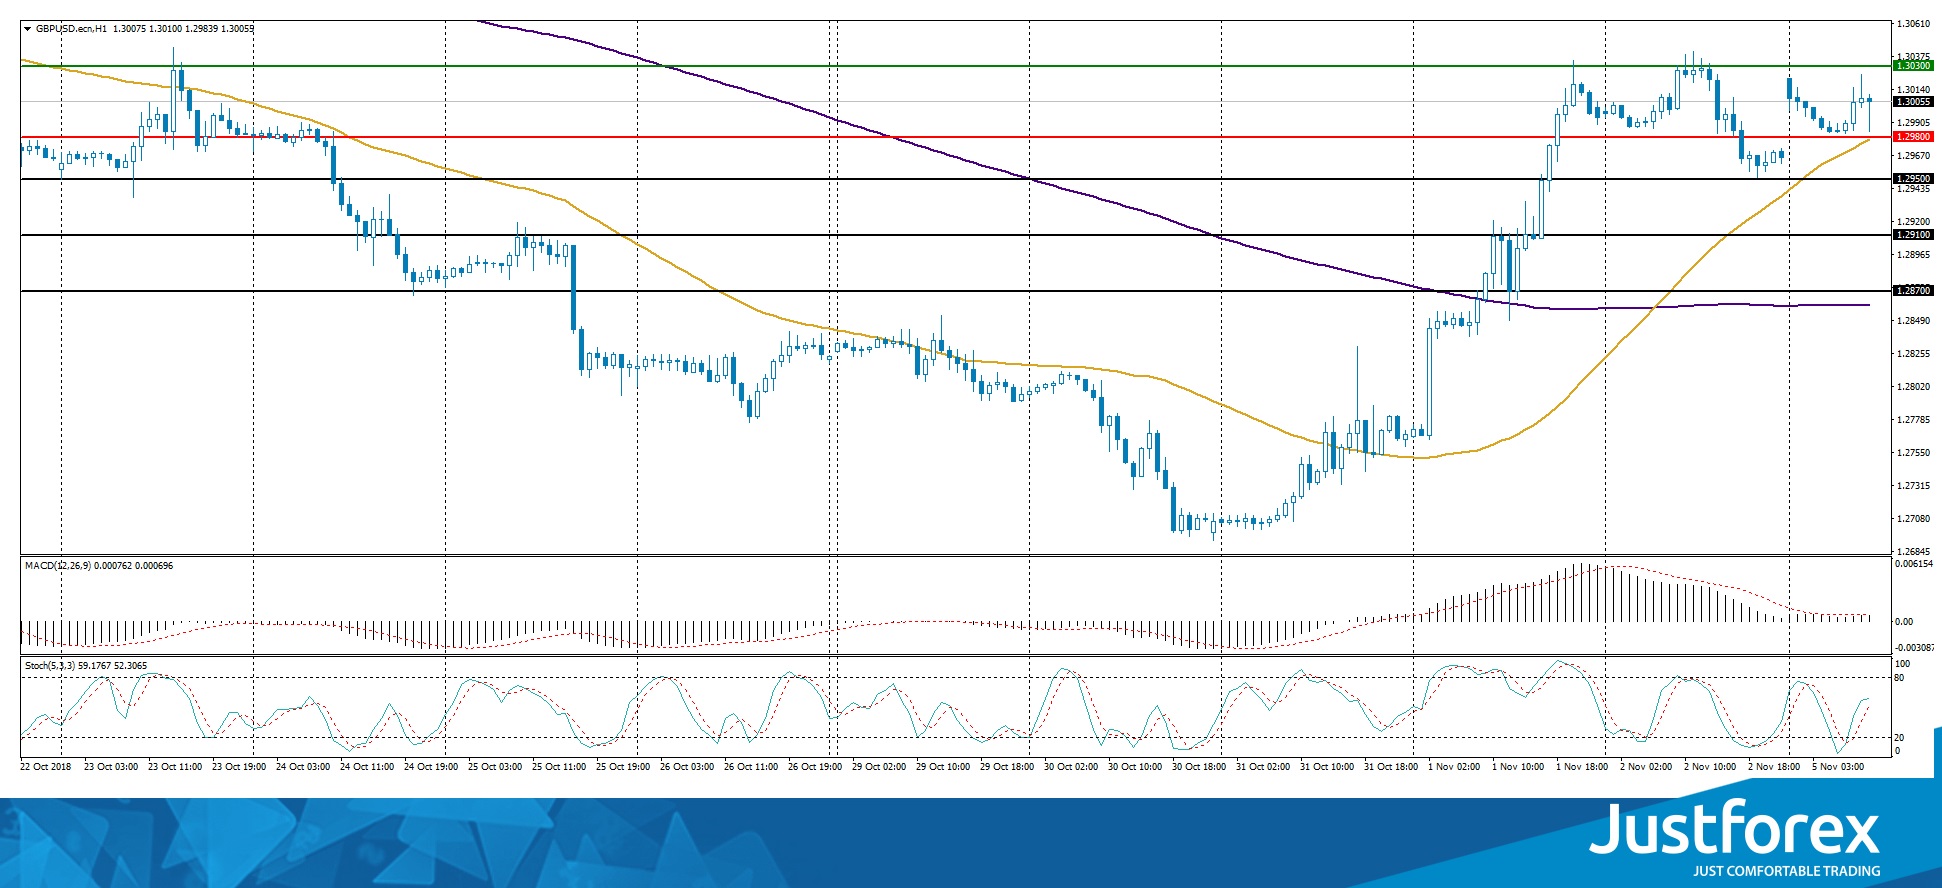
Indicators do not send accurate signals: the price is testing 50 MA.
The MACD histogram is in the positive zone, but below the signal line, which gives a weak signal to buy GBP/USD.
Stochastic Oscillator is in the neutral zone, the %K line is above the %D line, which indicates the bullish sentiment.
Trading recommendations
Support levels: 1.29800, 1.29500, 1.29100
Resistance levels: 1.30300, 1.30750
If the price fixes above the resistance level of 1.30300, a further increase in the GBP/USD currency pair is expected. The movement is tending to 1.30600-1.30800.
An alternative may be a drop in the GBP/USD quotes to 1.29500-1.29200.
The USD/CAD currency pair
Technical indicators of the currency pair:
Prev Open: 1.30847
Open: 1.30879
% chg. over the last day: +0.17
Day’s range: 1.30778 – 1.31127
52 wk range: 1.2248 – 1.3387
The technical pattern on the USD/CAD currency pair is ambiguous. At the moment, USD/CAD quotes are consolidating. Investors expect additional drivers. Local support and resistance levels are 1.30850 and 1.31200, respectively. Positions should be opened from these marks.
Today, the publication of important economic reports from Canada is not planned. We recommend paying attention to the speech by the Bank of Canada governor.
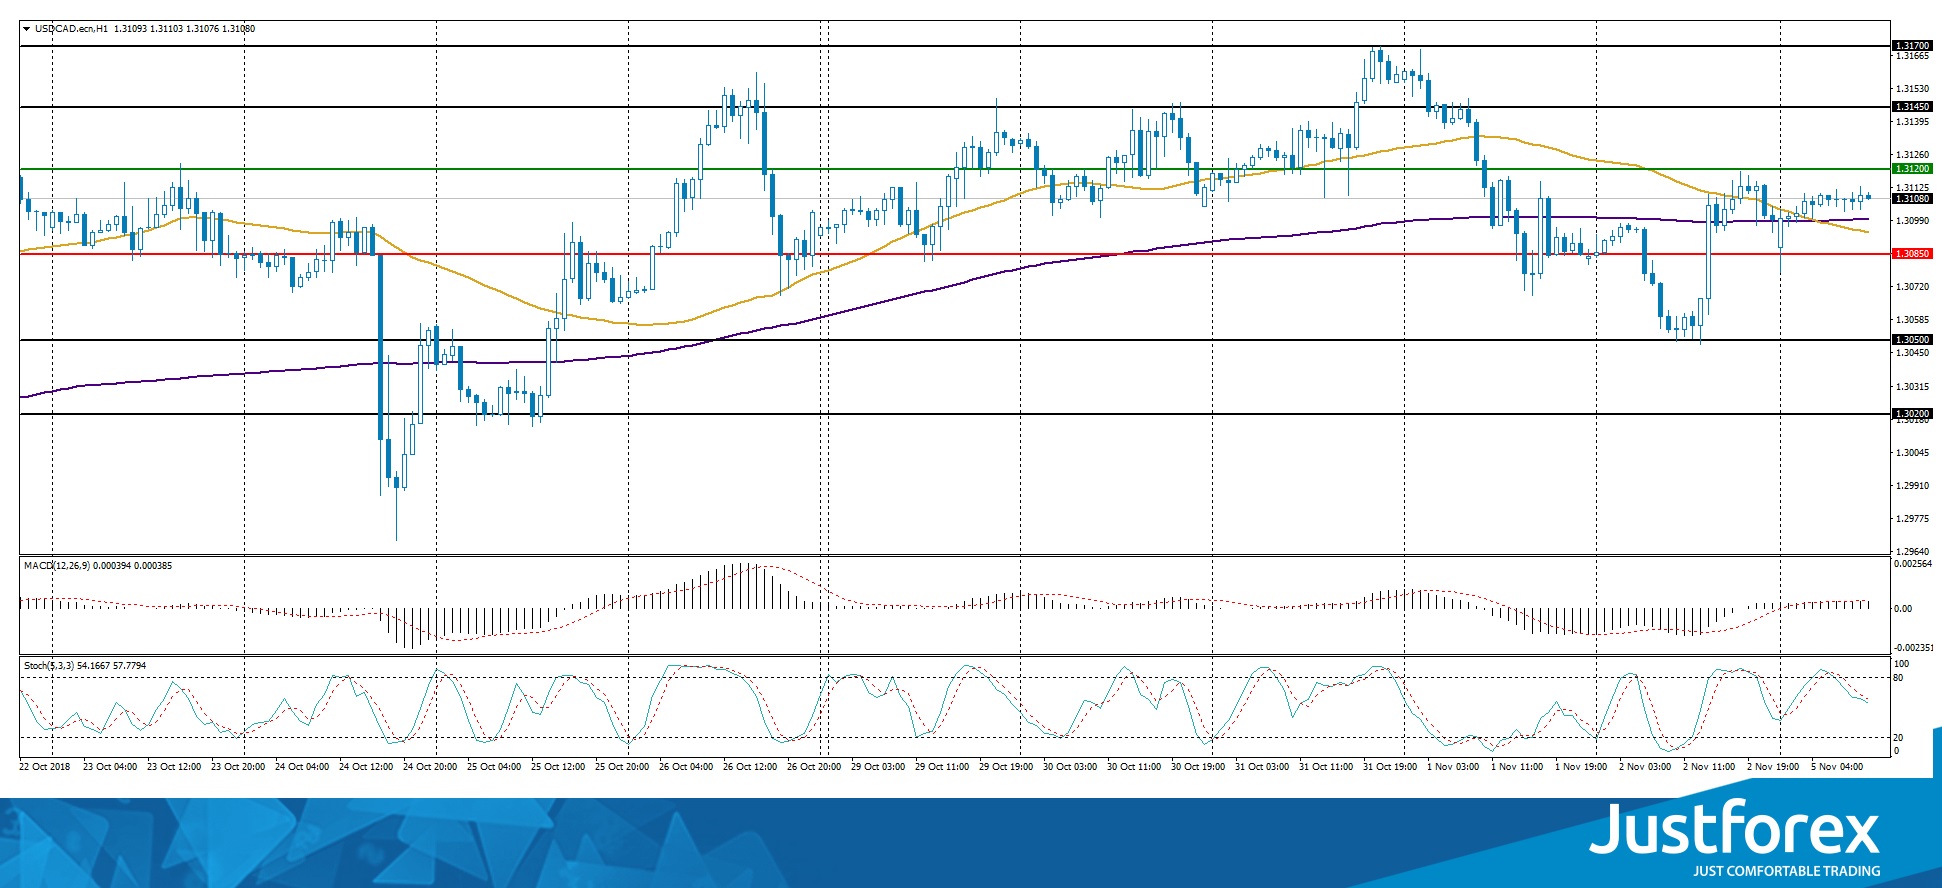
Indicators do not send accurate signals: 50 MA has crossed 200 MA.
The MACD histogram is in the positive zone, but below the signal line, which gives a weak signal to buy USD/CAD.
Stochastic Oscillator is in the neutral zone, the %K line is below the %D line, which indicates the bearish sentiment.
Trading recommendations
Support levels: 1.30850, 1.30500, 1.30200
Resistance levels: 1.31200, 1.31450, 1.31700
If the price fixes below the support of 1.30850, the USD/CAD quotes are expected to fall. The movement is tending to 1.30500-1.30300.
An alternative may be the growth of the USD/CAD currency pair to the level of 1.31450-1.31700.
The USD/JPY currency pair
Technical indicators of the currency pair:
Prev Open: 112.648
Open: 113.148
% chg. over the last day: +0.43
Day’s range: 113.108 – 113.337
52 wk range: 104.56 – 114.74
The USD/JPY currency pair is still in a sideways trend. The unidirectional trend is not observed. At the moment, the USD/JPY quotes are consolidating near the key resistance of 113.350. The round level of 113.000 is already a “mirror” support. We recommend paying attention to the US government bonds yield. Positions should be opened from the key levels.
The news feed on the economy of Japan is quite calm.
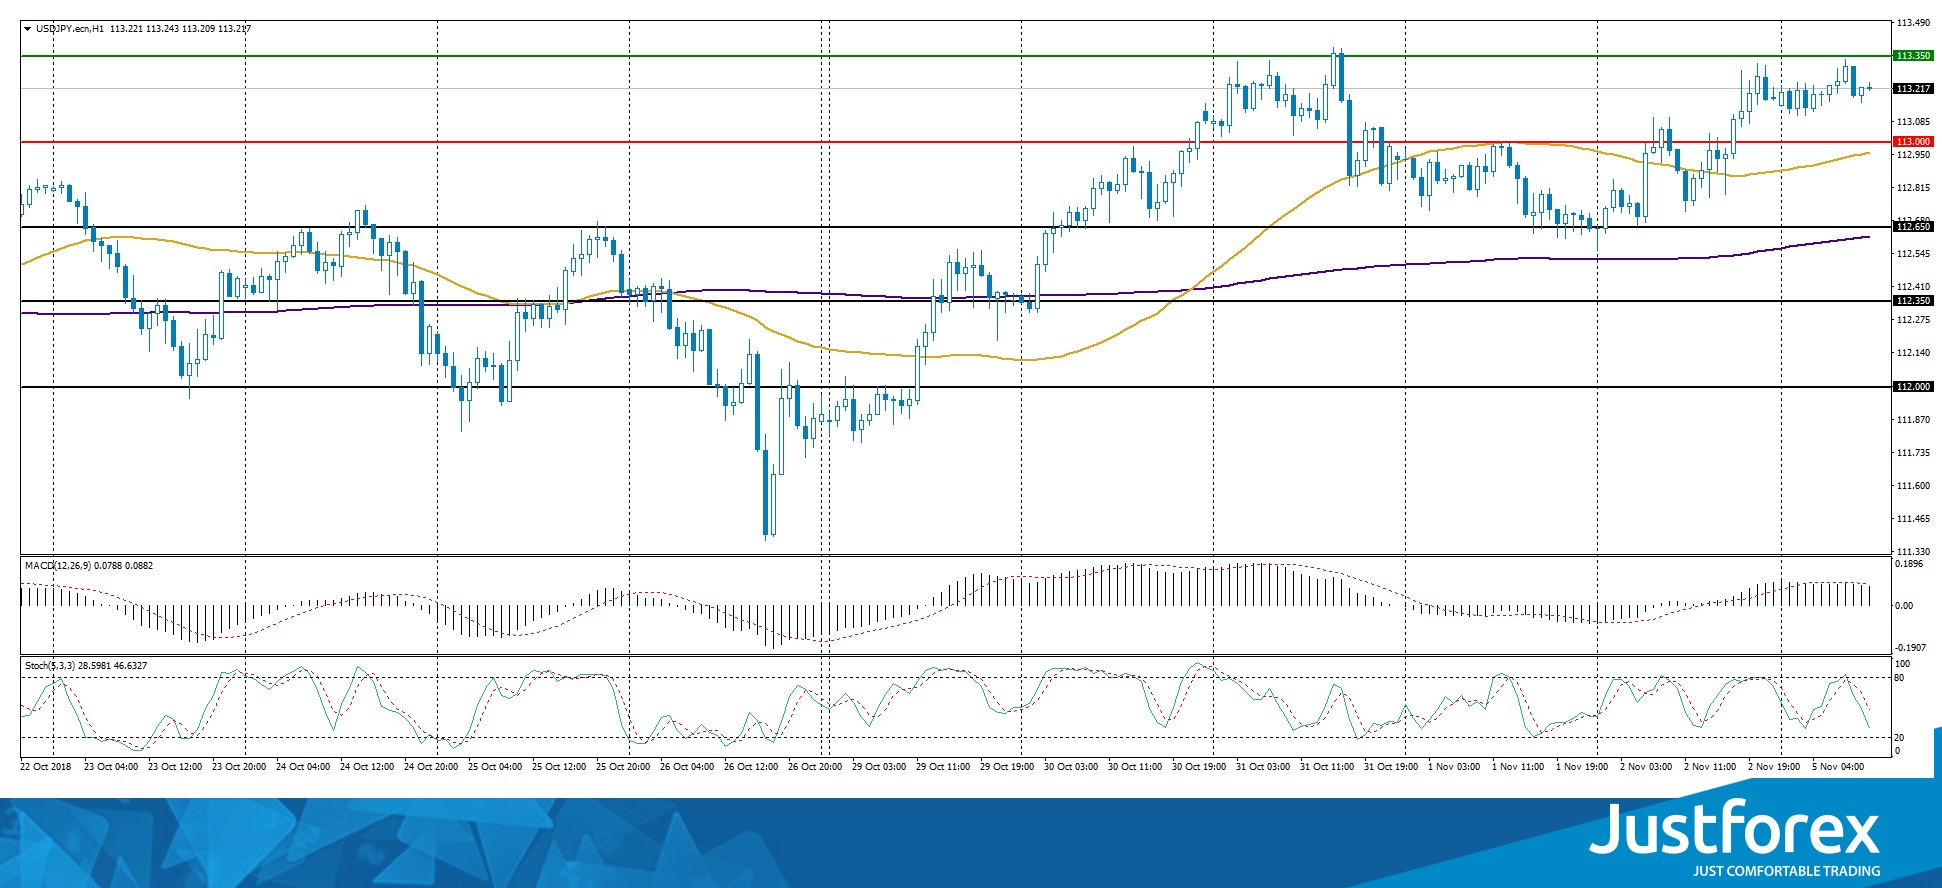
The price has fixed above 50 MA and 200 MA, which indicates the power of buyers.
The MACD histogram is in the positive zone, but below the signal line, which gives a weak signal to buy USD/JPY.
Stochastic Oscillator is in the neutral zone, the %K line is below the %D line, which indicates the bearish sentiment.
Trading recommendations
Support levels: 113.000, 112.650, 112.350
Resistance levels: 113.350, 113.700
If the price fixes above the resistance level of 113.350, the USD/JPY quotes growth is expected. The movement is tending to 113.700-114.000.
An alternative may be a decrease in the USD/JPY currency pair to 112.700-112.500.


