
The EUR/USD currency pair
Technical indicators of the currency pair:
Prev Open: 1.13223
Open: 1.12176
% chg. over the last day: -0.88
Day’s range: 1.12165 – 1.12573
52 wk range: 1.1299 – 1.2557
EUR is consolidating around the annual minimums. The key support and resistance levels are 1.12200 and 1.12600. The conflict between the EU and Italy remains in the spotlight. Nonetheless, a technical correction is possible soon. You should open positions from the key levels.
At 12:00 (GMT+2:00) an Economic Sentiment Index by ZEW will be published in Germany.
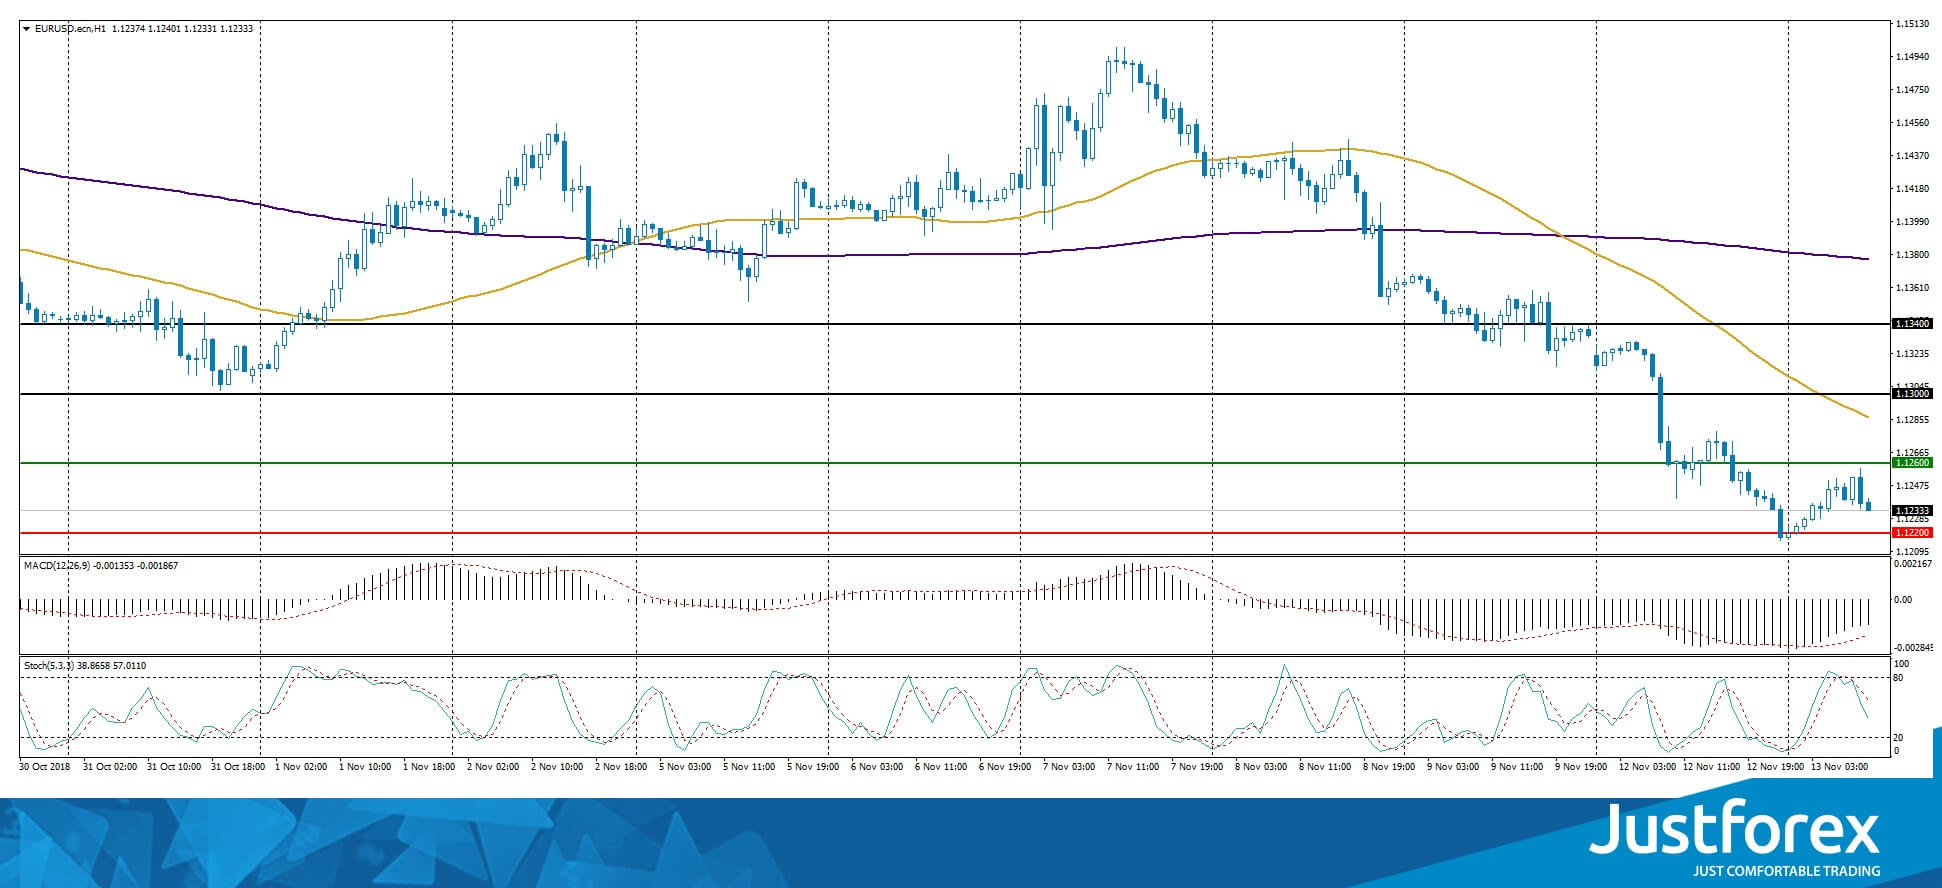
The indicators show the buyers` strength: the price fixed below 50 MA and 200 MA.
The MACD histogram is in the red but above the signal line, which gives a weak signal towards a sell-off of EUR/USD.
The Stochastic Oscillator is in the neutral zone, the %K line is below the %D line, which indicates a bearish sentiment.
Trading recommendations
Support levels: 1.12200, 1.12000, 1.11500
Resistance levels: 1.12600, 1.13000, 1.13400
If the price fixes below the support line 1.12200, we can expect further descend of the EUR/USD quotes. The movement will tend toward 1.11750-1.11500.
Alternatively, the price fixes above 1.12600, we can expect a correction of the EUR/USD. The movement will tend toward the round 1.13000.
The GBP/USD currency pair
Technical indicators of the currency pair:
Prev Open: 1.29182
Open: 1.28475
% chg. over the last day: -0.65
Day’s range: 1.28349 – 1.28970
52 wk range: 1.2662 – 1.4378
GBP/USD shows an uncertain technical picture. The pound is being traded in flat. The local support and resistance are 1.28400 and 1.29000. Positions should be opened from the key levels. The market participants are waiting for important stats from GB and new data regarding the Brexit process.
At 11:30 (GMT+2:00) we expect a Labour Market report from Great Britain.
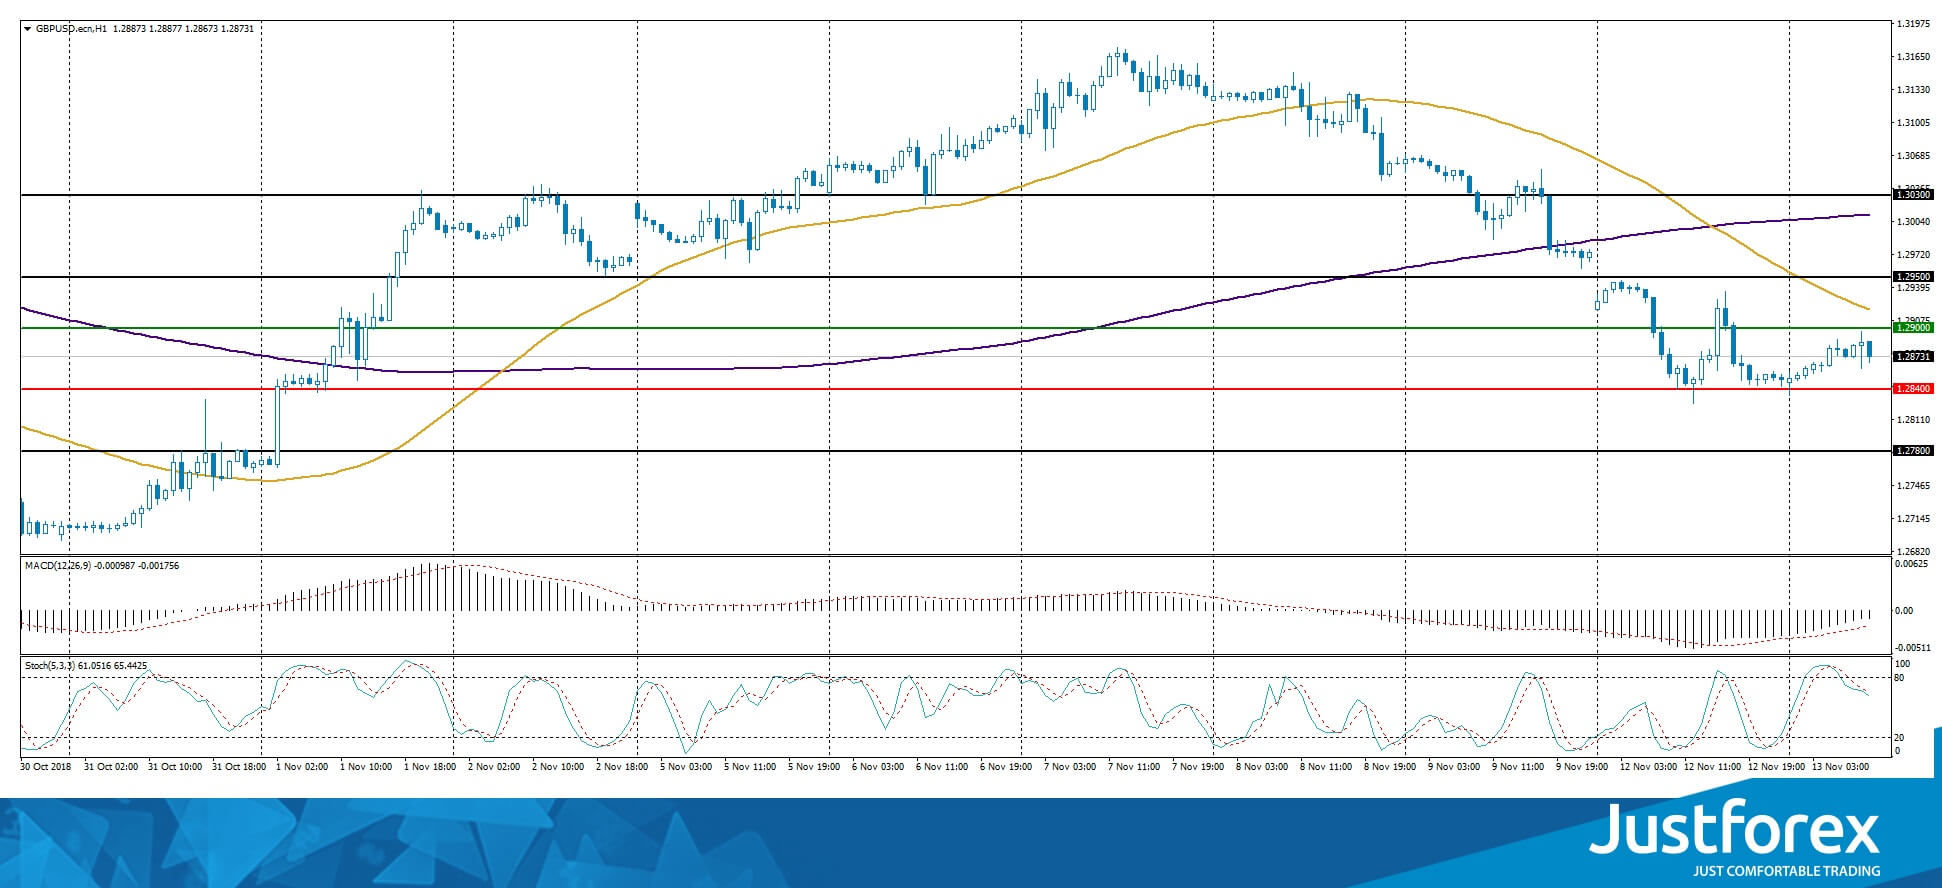
The indicators point towards the power of the buyers, the price fixed below 50 MA and 200 MA.
The MACD histogram is in the negative zone but above the signal line, which gives a weak signal towards the purchase of GBP/USD.
The Stochastic Oscillator is in the neutral zone, the %K line is below the %D line, which indicates a bearish sentiment.
Trading recommendations
Support levels: 1.28400, 1.27800
Resistance levels: 1.29000, 1.29500, 1.30300
If the price fixes below the local support 1.28400, we can expect further descend of the GBP/USD currency pair. The movement will tend toward 1.28000-1.27800.
Alternatively, the quotes can recover to the mirror support level of 1.29500.
The USD/CAD currency pair
Technical indicators of the currency pair:
Prev Open: 1.32034
Open: 1.32434
% chg. over the last day: +0.37
Day’s range: 1.32152 – 1.32481
52 wk range: 1.2248 – 1.3387
The USD/CAD currency pair keeps testing the monthly maximums. The local support and resistance are 1.32150 and 1.32500 respectively. The trading instrument has good growing prospects. Positions should be opened from the key levels. Also, keep an eye on the oil quotes` pricing.
The news feed for Canada is calm for today.
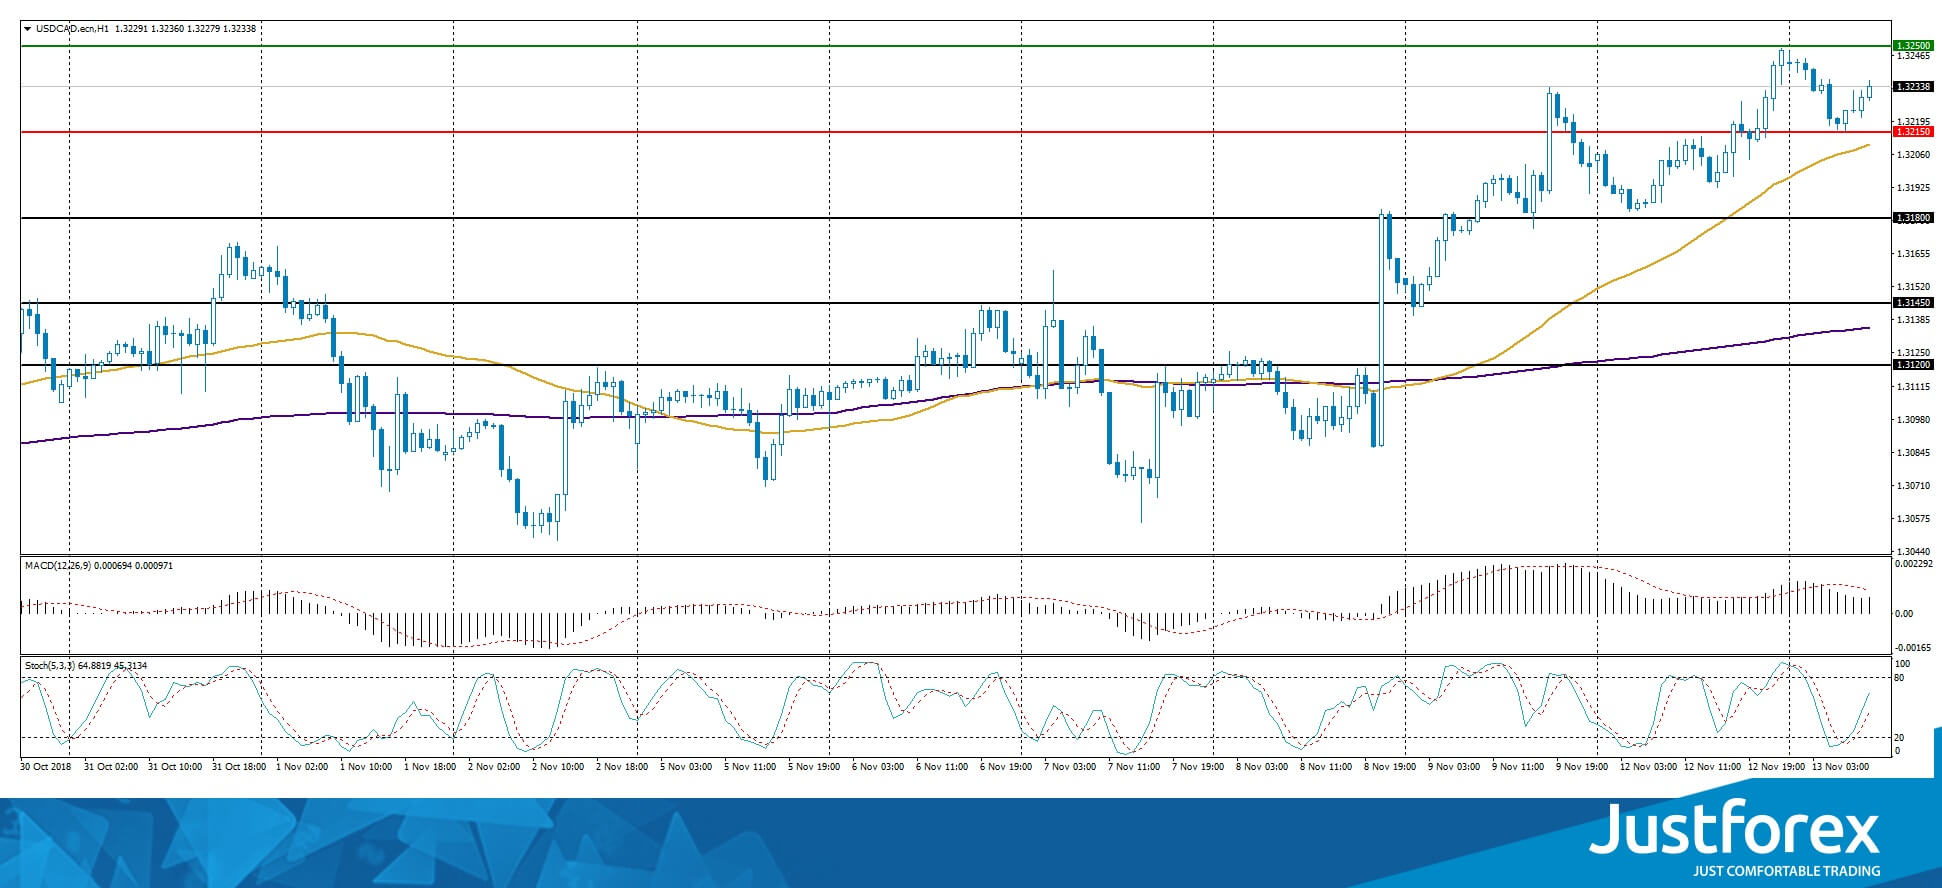
The indicators point towards the power of the buyers: the price fixed above 50 MA and 200 MA.
The MACD histogram is in the positive zone but below the signal line, which gives a weak signal towards the purchase of USD/CAD.
The Stochastic Oscillator is in the neutral zone, the %K line is above the %D line, which indicates a bullish sentiment.
Trading recommendations
Support levels: 1.32150, 1.31800, 1.31450
Resistance levels: 1.32500, 1.33000
If the price fixes above 1.32500 we recommend you to consider purchasing USD/CAD. The movement will tend toward the round 1.33000.
Alternatively, the currency pair can descend to 1.31800-1.31600.
The USD/JPY currency pair
Technical indicators of the currency pair:
Prev Open: 113.794
Open: 113.832
% chg. over the last day: -0.14
Day’s range: 113.580 – 114.130
52 wk range: 104.56 – 114.74
The last couple of sessions have had rather active USD/JPY trading. At the same time, there is no singular trend. The market participants are waiting for additional drivers. At the moment, the local support and resistance levels are 113.850 and 114.200. Positions should be opened from these levels.
No important economic statistics are expected from Japan today.
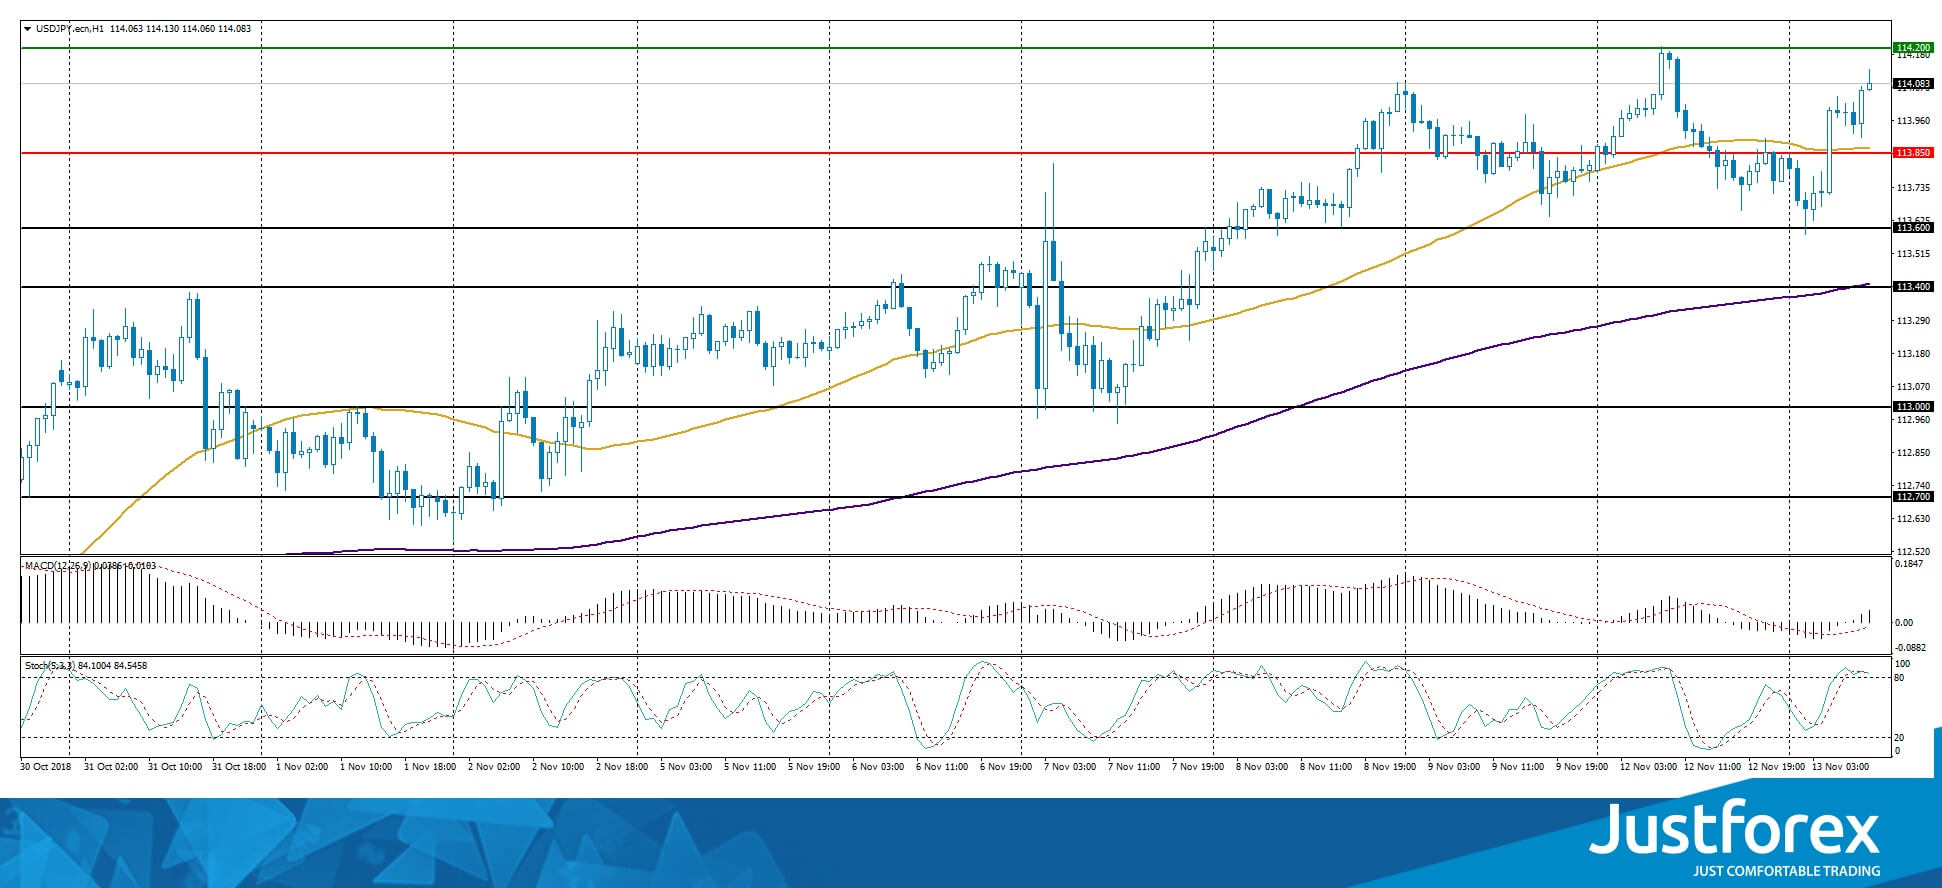
The price fixed above 50 MA and 200 MA, which indicates the power of the buyers.
The MACD histogram switched into the positive zone, which indicates a bullish sentiment.
The Stochastic Oscillator is in the neutral zone, the %K line has crossed the %D line. No signals are expected at the moment.
Trading recommendations
Support levels: 113.850, 113.600, 113.400
Resistance levels: 114.200, 114.500
If the price fixes above the resistance line 114.200 we can expect further growth towards 114.500-114750.
Alternatively the USD/JPY can descend towards 113.600-113.400.


