
The EUR/USD currency pair
Technical indicators of the currency pair:
Prev Open: 1.12176
Open: 1.12892
% chg. over the last day: +0.83
Day’s range: 1.12762 – 1.13212
52 wk range: 1.1299 – 1.2557
EUR started to recover. During the yesterday“s trade, the EUR/USD quotes grew by more than 85% points. The trading instrument updated the local maximums. At the moment EUR/USD is consolidating. The key range is 1.12700-1.13100. A correction is possible soon. The investors are expecting important economic stats from the US. Positions should be opened from the key levels.
The Economic News Feed for 2018.11.14:
preliminary report on the GDP (EU) – 12:00 (GMT+2:00);
CPI Index (US) – 15:30 (GMT+2:00).
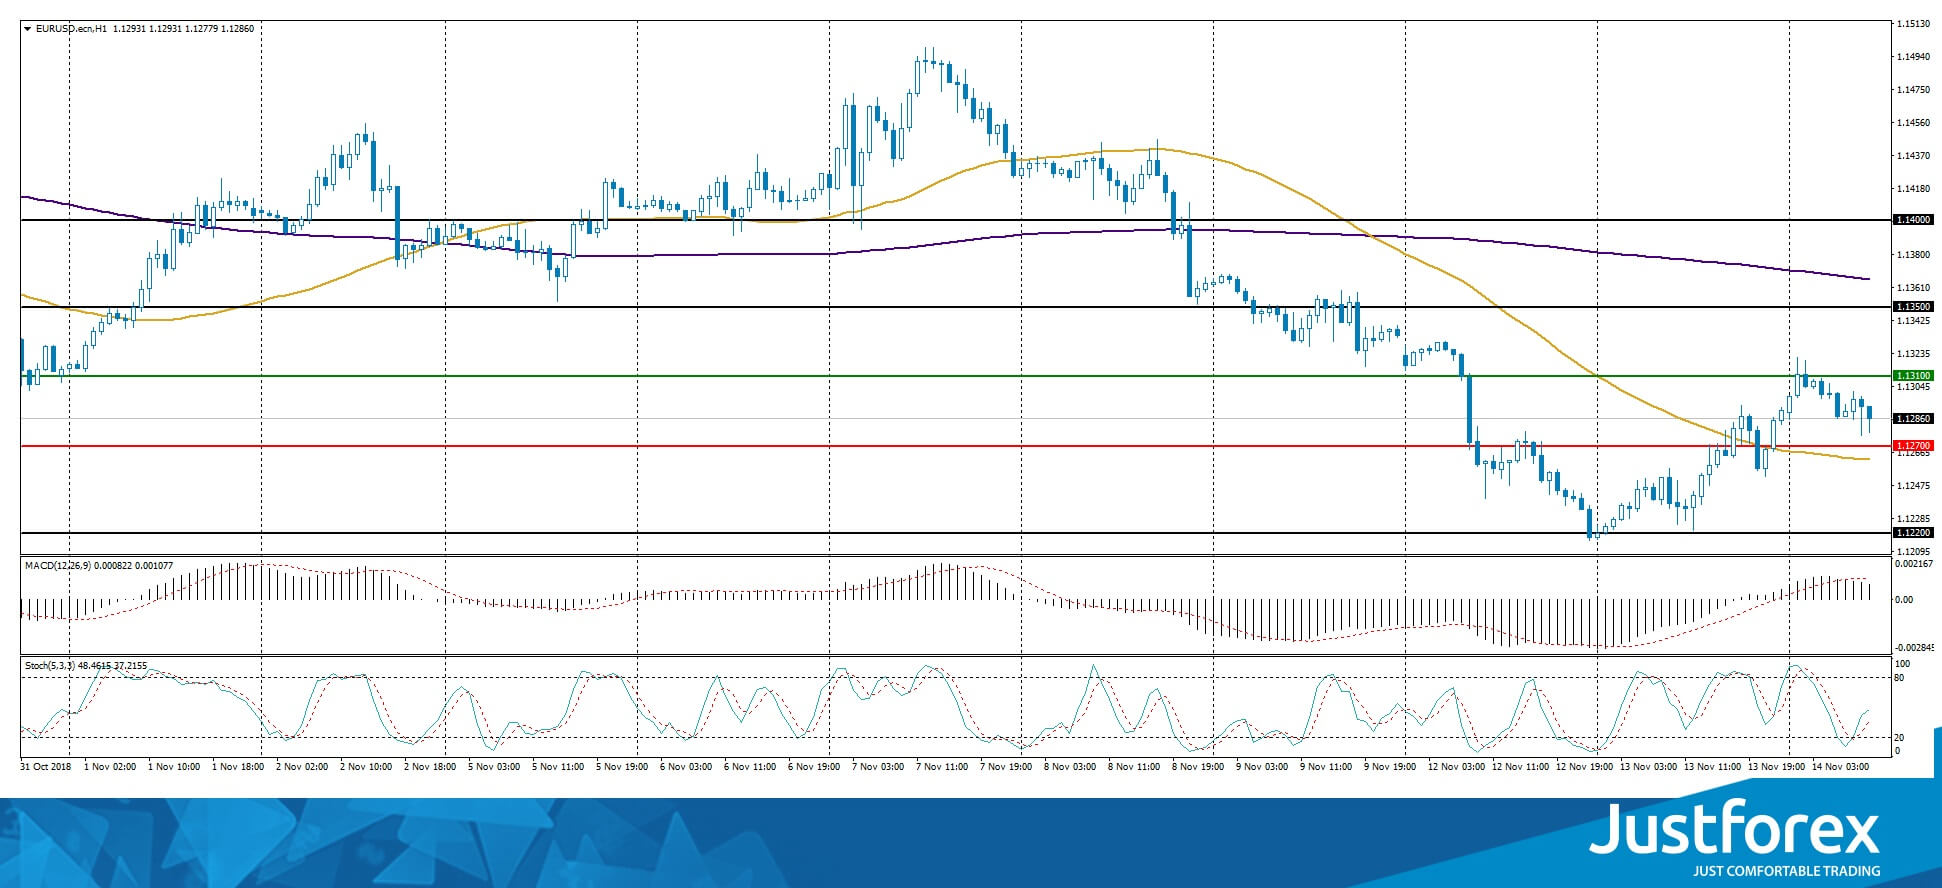
The indicators do not provide precise signals, the price fixed between 50 MA and 200 MA, which represent strong dynamic levels of support and resistance.
The MACD histogram is in the positive zone but below the signal line, which give a weak signal towards the purchase of EUR/USD.
The Stochastic Oscillator is in the neutral zone, the %K line is above the %D line, which indicates a bullish sentiment.
Trading recommendations
Support levels: 1.12700, 1.12200, 1.12000
Resistance levels: 1.13100, 1.13500, 1.14000
If the price closes above the support 1.13100, expect further correction. The movement will tend toward 1.13500-1.13800.
Alternatively, the price fixes below 1.13100, and you should consider selling EUR/USD. The movement will tend toward 1.12300-1.12000.
The GBP/USD currency pair
Technical indicators of the currency pair:
Prev Open: 1.28475
Open: 1.29710
% chg. over the last day: +1.28
Day’s range: 1.29553 – 1.30348
52 wk range: 1.2662 – 1.4378
Yesterday the GBP/USD was showing some agressive purchasing. The quotes have grown by 150 points and updated the local maximums. Great Britain and the EU reached a preliminary conslusion on Brexit after some long negotiations. The pound can recover further. The key trading range is 1.29500-1.30150. Positions should be opened from these levels.
At 11:30 (GMT+2:00) Great Britain will publish a Customer Price Index.
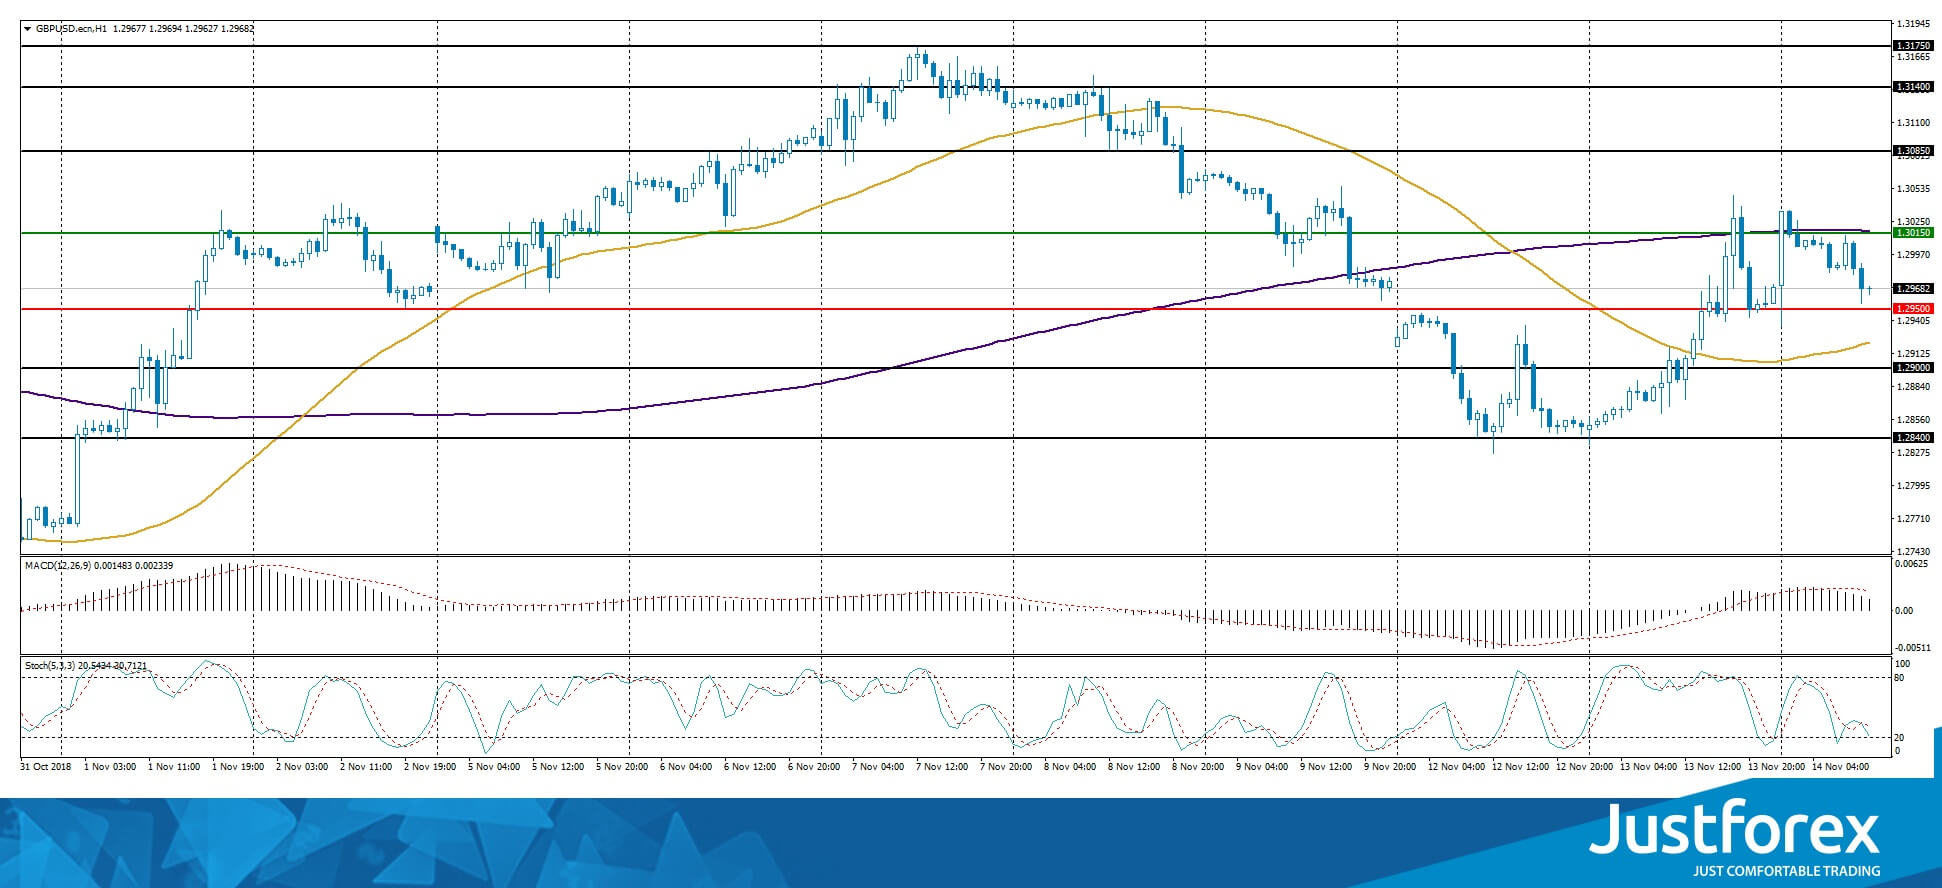
Indicators do not provide precise signals, the price fixed between 50 MA and 200 MA.
The MACD histogram is in the green but below the signal line, which gives a weak signal towards a purchase of GBP/USD.
The Stochastic Oscillator is around the overbought zone, the %K line crossed the %D. There are no signals at the moment.
Trading recommendations
Support levels: 1.28400, 1.27800
Resistance levels: 1.30150, 1.30850, 1.31400
If the price fixes above 1.30150 expect further growth of GBP/USD. The movement will tend toward 1.30750-1.31000.
Alternatively, the quotes can go down towards the round 1.29000.
The USD/CAD currency pair
Technical indicators of the currency pair:
Prev Open: 1.32434
Open: 1.32341
% chg. over the last day: -0.17
Day’s range: 1.32182 – 1.32485
52 wk range: 1.2248 – 1.3387
The USD/CAD quotes keep consolidating. There is not singular trend. The key support and resistance levels are still 1.32150 and 1.32500. Positions should be opened from these levels. The market participants are expecting the inflation stats from the US.
The news feed for Canada is calm for today.
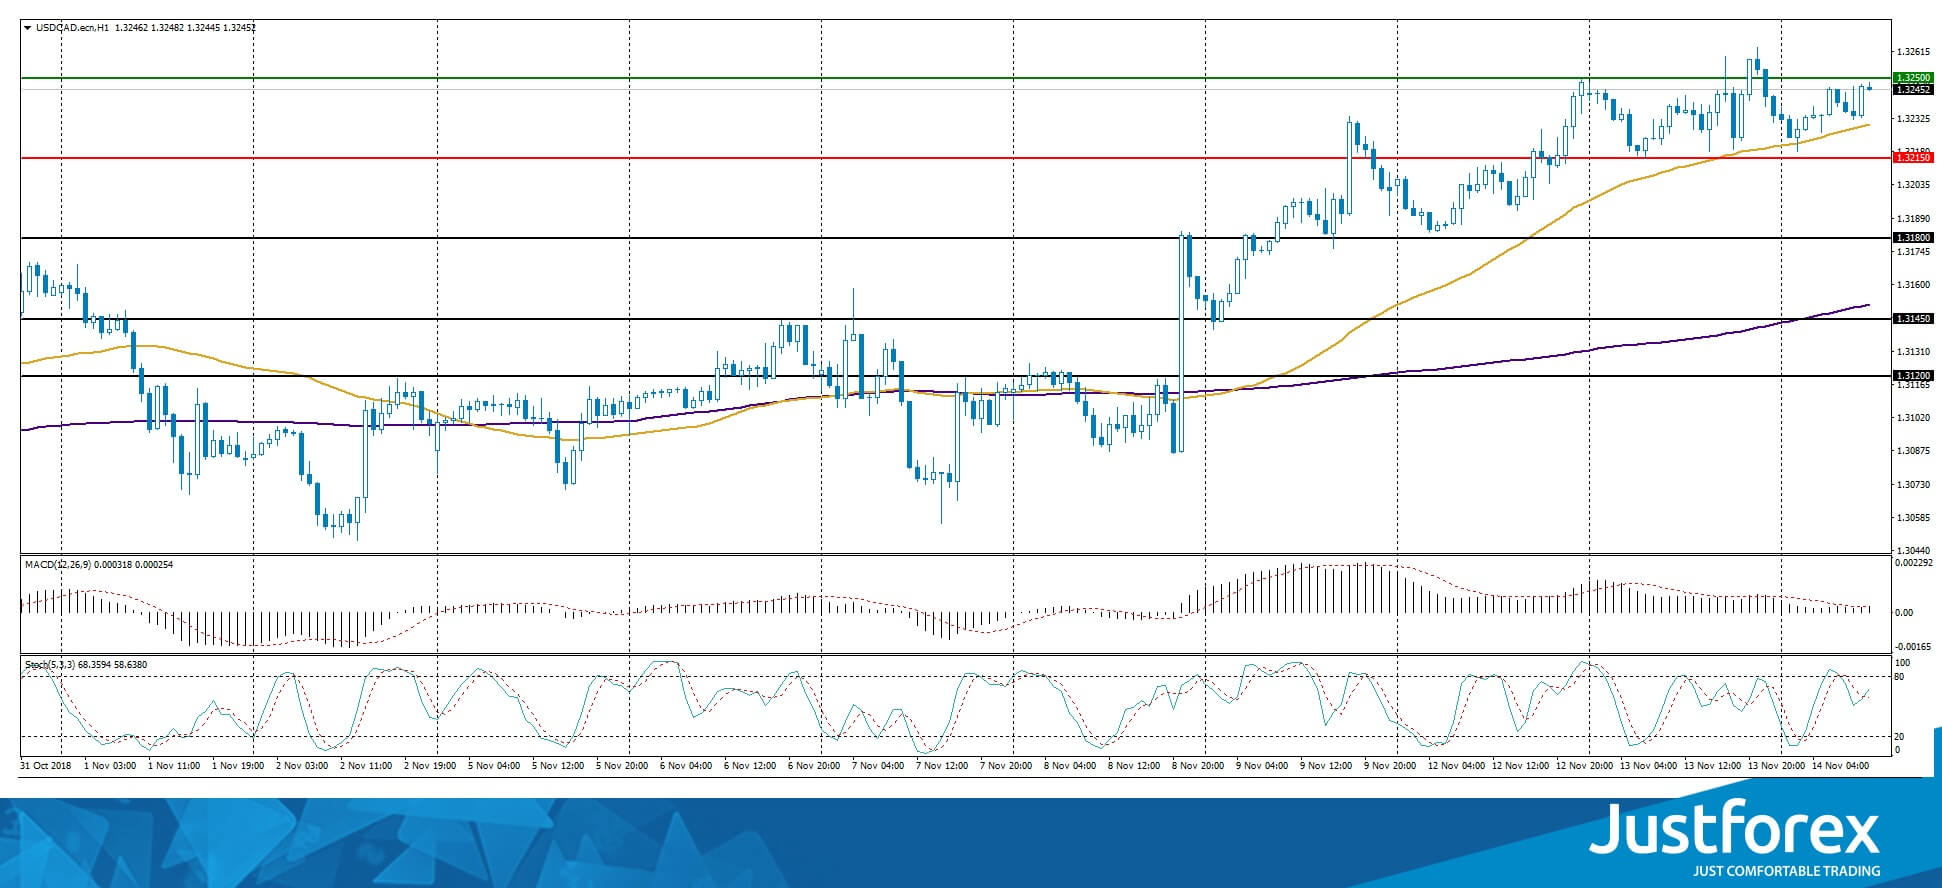
The price fixes above 50 МА and 200 МА, which indicates the power of the buyers`.
The MACD histogram is in the positive zone and keeps rising, which gives a signal towards a purchase of USD/CAD.
The Stochastic Oscillator is in the Neutral zone, the %K line crosses the %D line. There are no signals at the moment..
Trading recommendations
Support levels: 1.32150, 1.31800, 1.31450
Resistance levels: 1.32500, 1.33000
If the price fixes above 1.32500, consider purchasing USD/CAD. The movement will tend toward the round 1.33000.
Alternatively, the currency pair can descend to 1.32000-1.31800.
The USD/JPY currency pair
Technical indicators of the currency pair:
Prev Open: 113.832
Open: 113.784
% chg. over the last day: -0.03
Day’s range: 113.752 – 113.989
52 wk range: 104.56 – 114.74
USD/JPY remains in the long flat. The technical picture is ambiguous. At the moment the local support and resistance are 113.700 and 114.000. Correction is highly possible due to the rapid growth since the end of October. You should keep an eye on the US Economic News Feed.
During the Asian trading session, Japan published rather weak GDP reports.
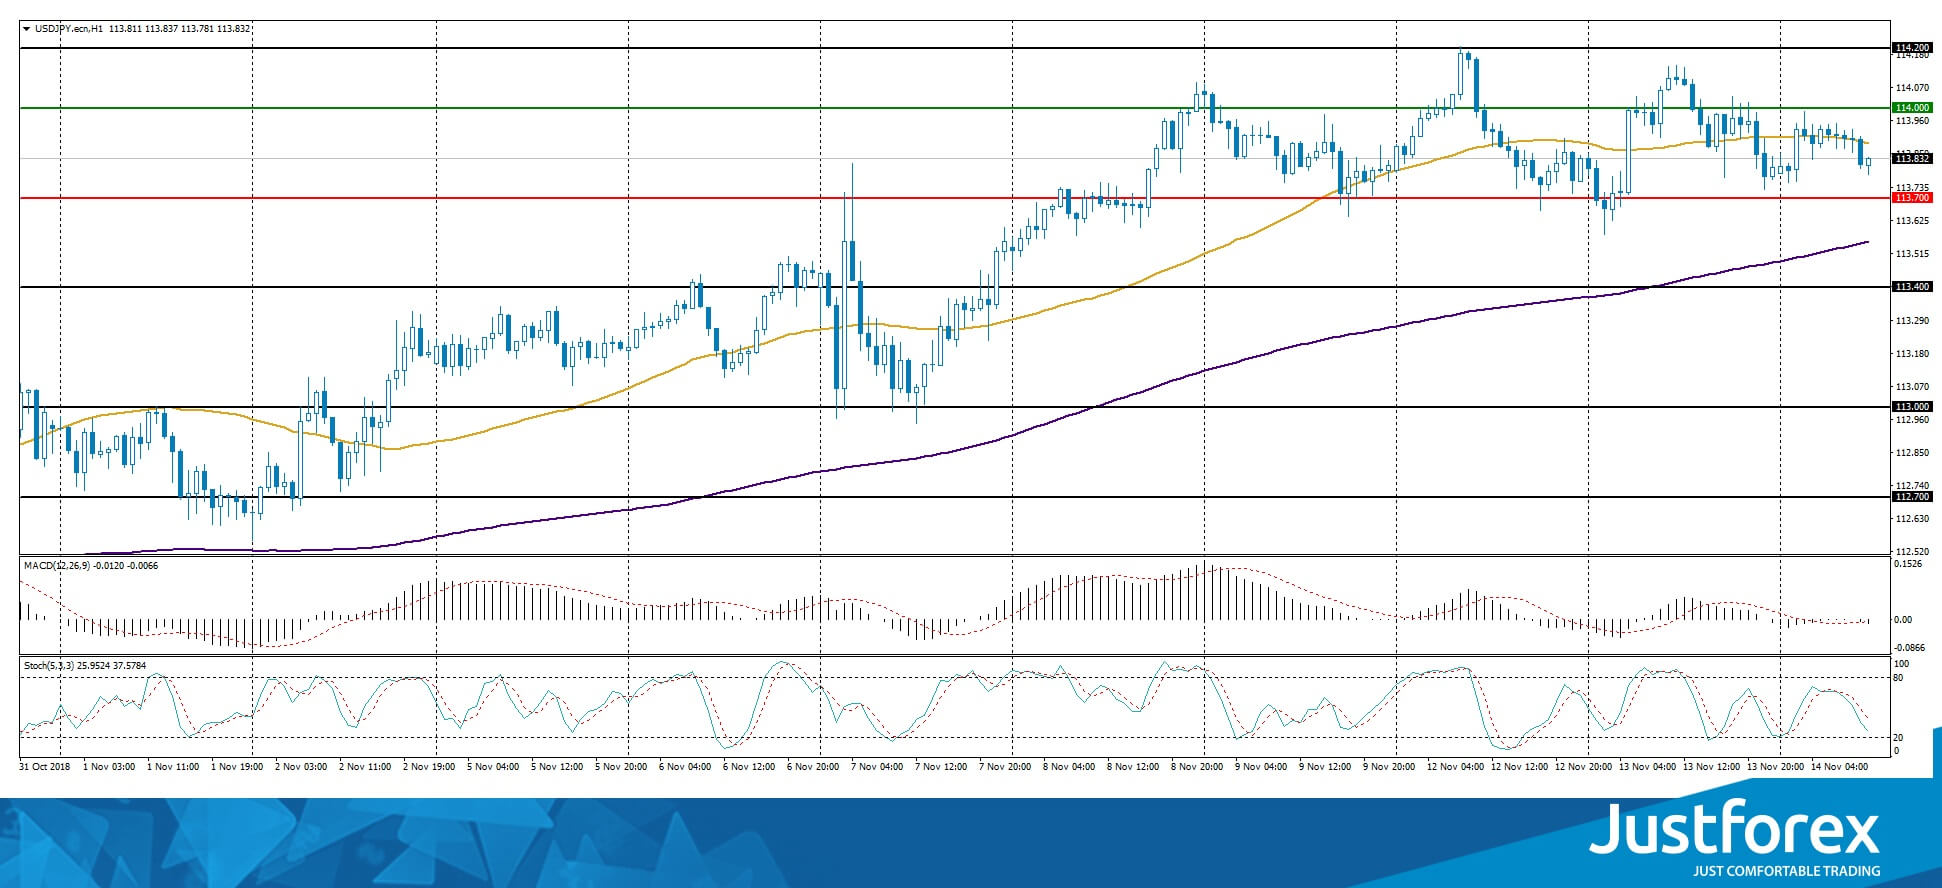
Indicators do not provide precise signals: the price crossed 50 МА.
The MACD histogram is around 0. There are no signals at the moment.
The Stochastic Oscillator is in the neutral zone, the %K line is below the %D line, which gives a weak signal towards the sale of USD/CAD.
Trading recommendations
Support levels: 113.700, 113.400, 113.000
Resistance levels: 114.000, 114.200, 114.500
If the price fixes above the round 114.000, expect futher growth of the USD/JPY quotes. The movement will tend toward 114.200-114.500.
Alternatively, the quotes can descend towards 113.500-113.300.


