
The EUR/USD currency pair
Technical indicators of the currency pair:
Prev Open: 1.13870
Open: 1.14404
% chg. over the last day: +0.16
Day’s range: 1.13657 – 1.14186
52 wk range: 1.1299 – 1.2557
Yesterday the EUR/USD were in a sidewards trend. The trading activity was lowered due to the Thanksgiving in the US. At the moment the quotes started to descend. The key support and resistance levels are 1.13600 and 1.14100. Positions should be opened from these levels.
Investors expect an array of business indices from the EU and Germany at 10:30 (GMT+2) and 11:00 (GMT+2).
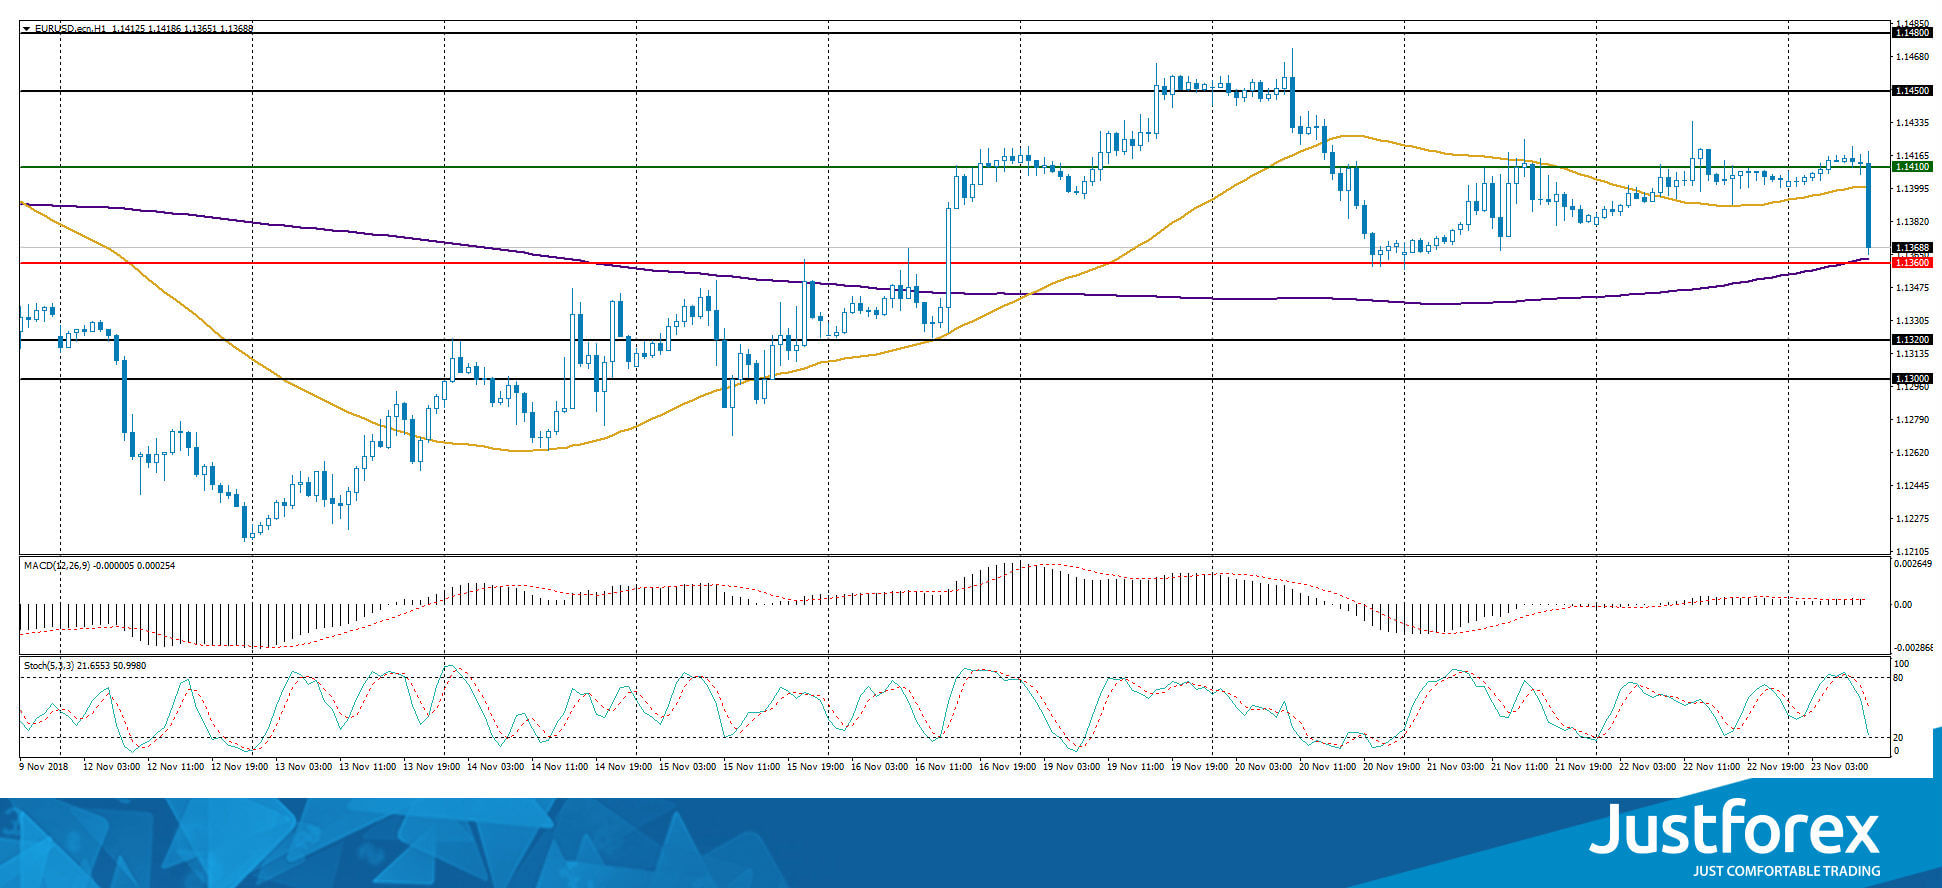
Indicators do not send accurate signals: the price has crossed 50 MA.
The MACD histogram is near the 0 mark.
Stochastic Oscillator is in the neutral zone, the %K line has is below the %D line, which indicates a bearish sentiment.
Trading recommendations
Support levels: 1.13600, 1.13200, 1.13000
Resistance levels: 1.14100, 1.14500, 1.14800
If the price fixes below the 1.13600 support, expect the EUR/USD to fall further. The movement will tend toward 1.13200-1.13000.
Alternatively, the quotes can grow toward 1.14000-1.14200.
The GBP/USD currency pair
Technical indicators of the currency pair:
Prev Open: 1.27710
Open: 1.28739
% chg. over the last day: +0.78
Day’s range: 1.28303 – 1.28746
52 wk range: 1.2662 – 1.4378
Yesterday, GBP/USD was showing an aggressive buy-out. The quotes grew by 120 points. GBP is supported by the great prospects regarding Brexit. The key range is 1.28300-1.28750. Positions should be opened from these levels.
Today the publication of important economic reports from the UK is not planned.
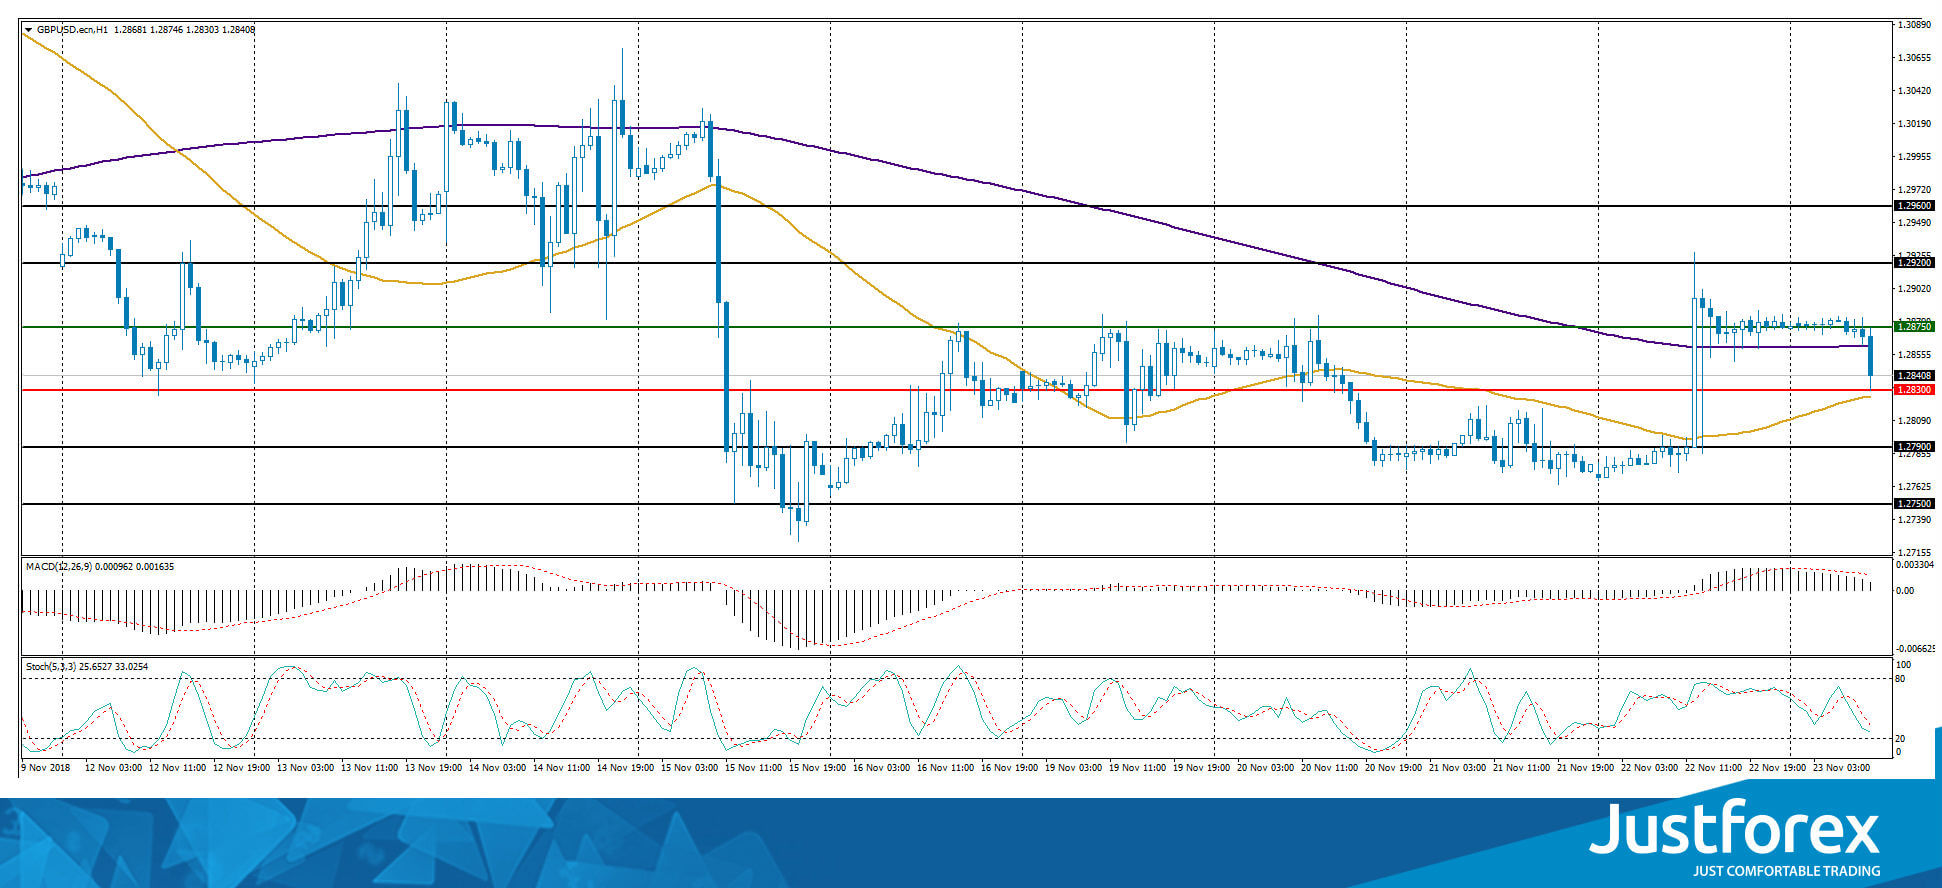
The price has fixed between 50 MA and 200 MA, which act as the dynamic support and resistance levels.
The MACD histogram is in the positive zone but below the signal line, which give a weak signal towards the purchase of GBP/USD.
Stochastic Oscillator is in the neutral zone, the %K line is below the %D line, which indicates the bearish sentiment.
Trading recommendations
Support levels: 1.28300, 1.27900, 1.27500
Resistance levels: 1.28750, 1.29200, 1.29600
If the price fixes below the support level of 1.28300, the GBP/USD quotes are expected to fall. The movement is tending to 1.27900-1.27500.
An alternative may be the GBP/USD currency pair growth to 1.29200-1.29600.
The USD/CAD currency pair
Technical indicators of the currency pair:
Prev Open: 1.32314
Open: 1.31866
% chg. over the last day: -0.30
Day’s range: 1.31941 – 1.32205
52 wk range: 1.2248 – 1.3387
USD/CAD currency pair was showing a variety of trends. The financial market participants expect for the important economic stats from Canada. The key support and resistance levels are 1.32000 and 1.32250. Positions should be opened from these levels.
At 15:30 (GMT+2) Canada will publish reports on inflation and retail sales.
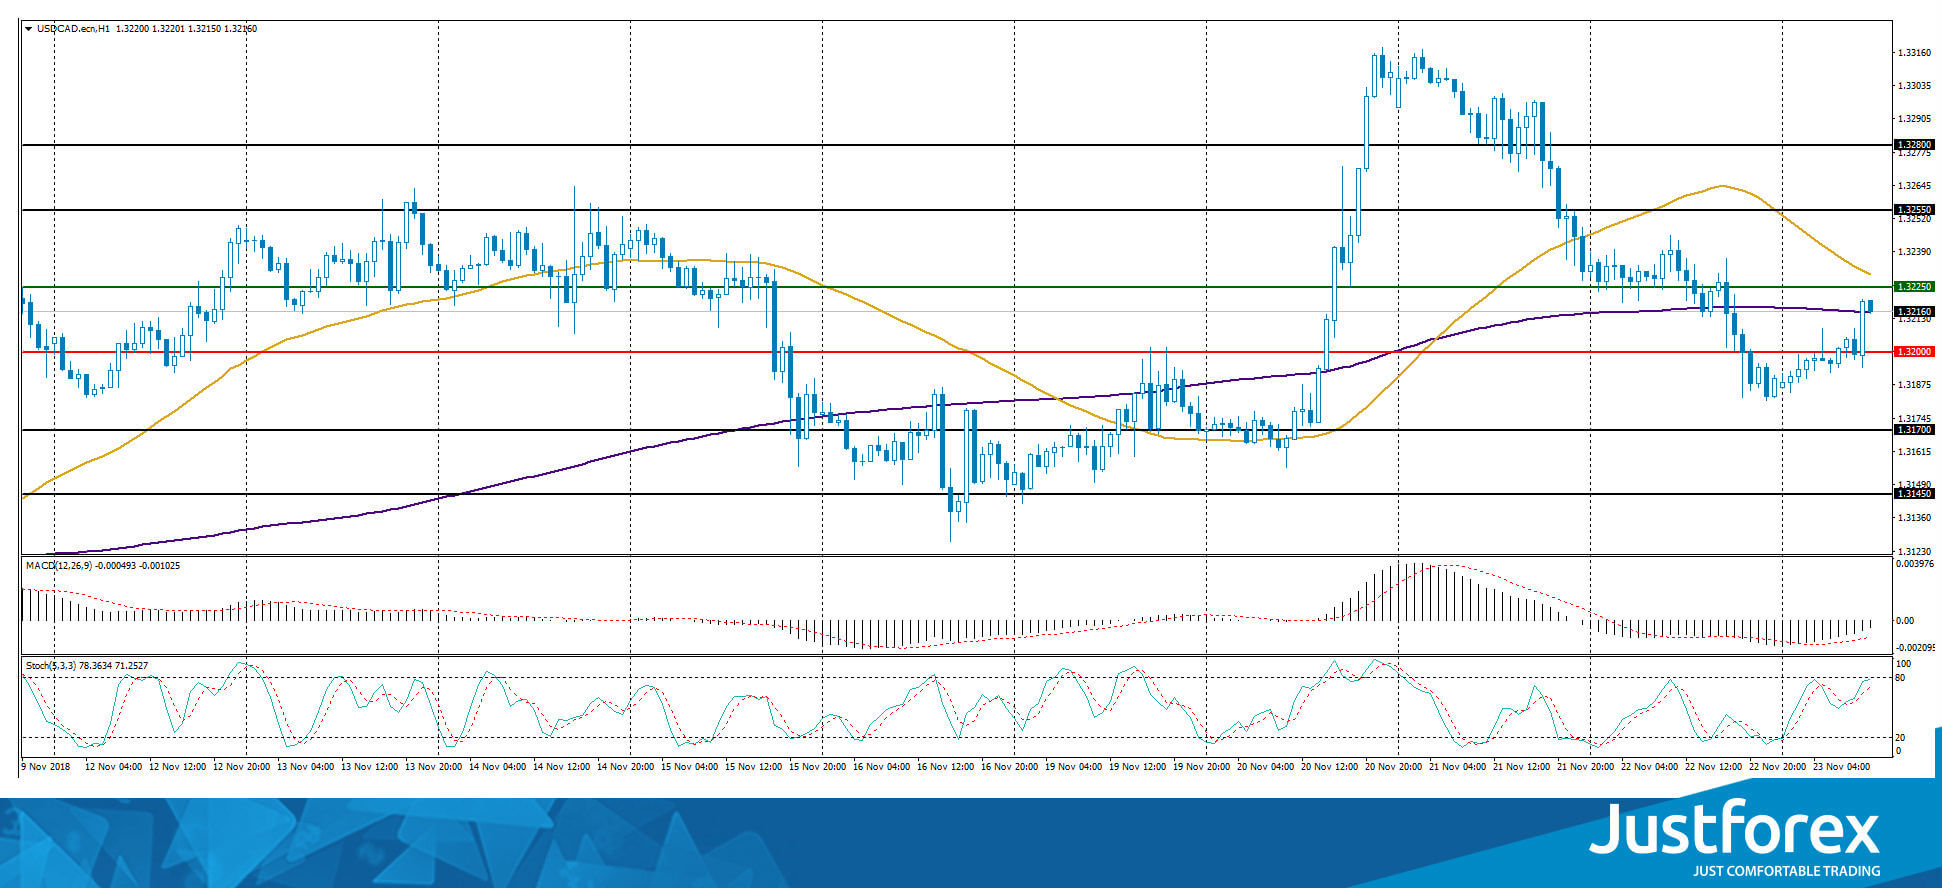
Indicators do not provide precise signals, the price is testing 200 MA.
The MACD histogram is in the negative zone, but above the signal line, which gives a weak signal to sell USD/CAD.
Stochastic Oscillator is in the neutral zone, the %K line is above the %D line, which indicates the bullish sentiment.
Trading recommendations
Support levels: 1.32000, 1.31700, 1.31450
Resistance levels: 1.32250, 1.32550, 1.32800
If the price fixes above the mirror resistance level of 1.32250, you should consider purchasing USD/CAD. The movement will tend toward 1.32500-1.32800.
Alternatively, if the price fixes below 1.32000, you should look for the market entry points to open the short positions. The movement will tend toward 1.31700-1.31500.
The USD/JPY currency pair
Technical indicators of the currency pair:
Prev Open: 113.056
Open: 112.939
% chg. over the last day: -0.06
Day’s range: 112.834 – 112.883
52 wk range: 104.56 – 114.74
The technical pattern on the USD/JPY currency pair is ambiguous. At the moment, quotes are consolidating. The key support and resistance levels are 112.750 and 113.000, respectively. We recommend paying attention to the dynamics of the US government bonds. Positions should be opened from the key levels. The trading instrument is tending to decline.
Publication of important economic reports from Japan is not planned. Financial markets are closed due to a national holiday.
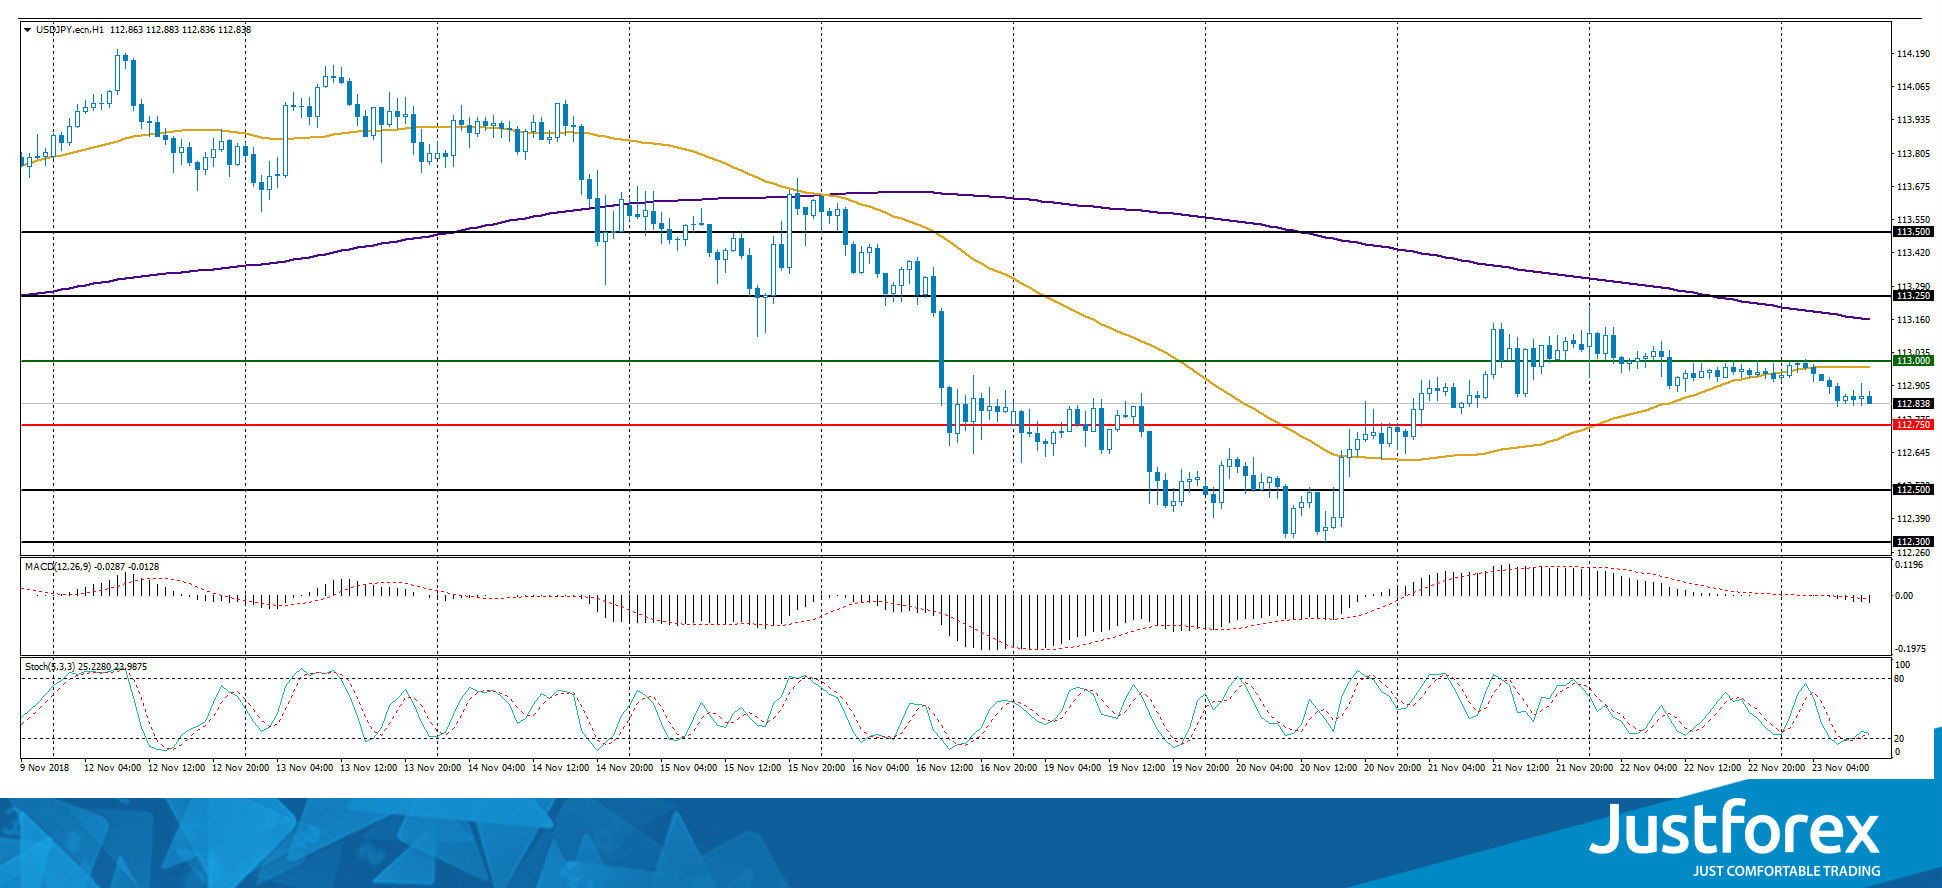
Indicators indicate the power of the sellers: the price has fixed below 50 MA and 200 MA.
The MACD histogram moved into the negative zone, which creates a signal to sell USD/JPY.
Stochastic Oscillator is in near the oversold zone, the %K line crosses the %D line. There are no signals at the moment.
Trading recommendations
Support levels: 112.750, 112.500, 112.300
Resistance levels: 113.000, 113.250, 113.500
If the price fixes below the support level of 112.750, the USD/JPY quotes are expected to fall. The movement is tending to 112.500-112.300.
An alternative may be the USD/JPY currency pair growth to 113.250-113.500.


