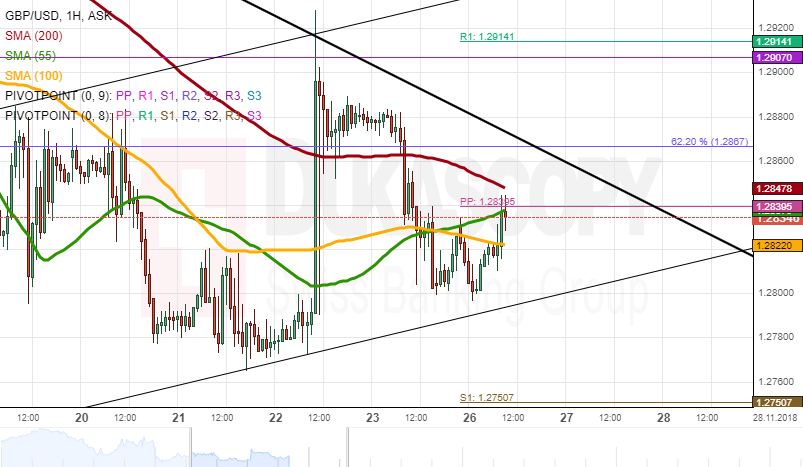
On Monday morning the GBP/USD pair surged to a technical resistance cluster at 1.2840 level. At that level the combination of the 55 and 200-hour simple moving averages was located close by. In addition, these resistance levels were strengthened by the weekly pivot point level, which was located exactly at 1.2840.
If the pair breaks these technical resistance levels, it will be expected to surge up to the 1.2870 level. At that level it would meet with the resistance of the 62.20% Fibonacci retracement level and the upper trend line of a long term channel down pattern.
On the other hand, the rate might bounce off the resistance and retreat first to the 100-hour SMA at 1.2820 and afterwards to the lower trend line of a medium term pattern near 1.2800.