HomeContributorsTechnical AnalysisUSDJPY Reversal Zoneat Deep 88.6% Fibonacci Target

USDJPY Reversal Zoneat Deep 88.6% Fibonacci Target

The ABCDE (purple) triangle chart pattern could be part of a larger bearish ABC (pink) wave pattern.

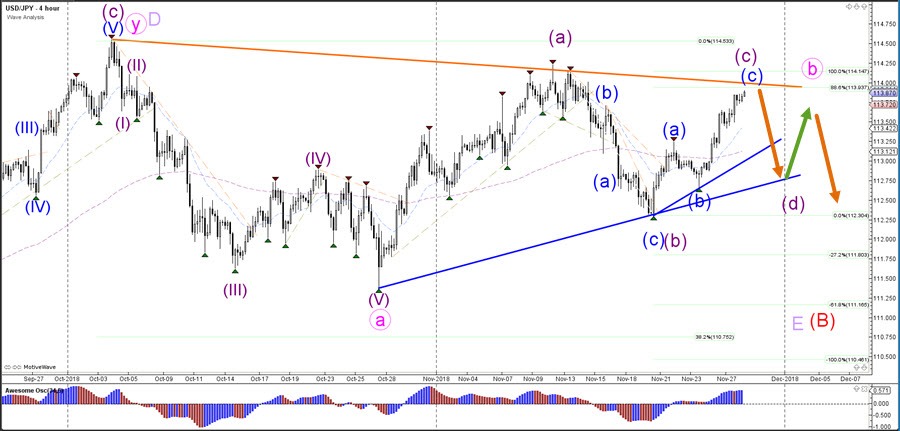
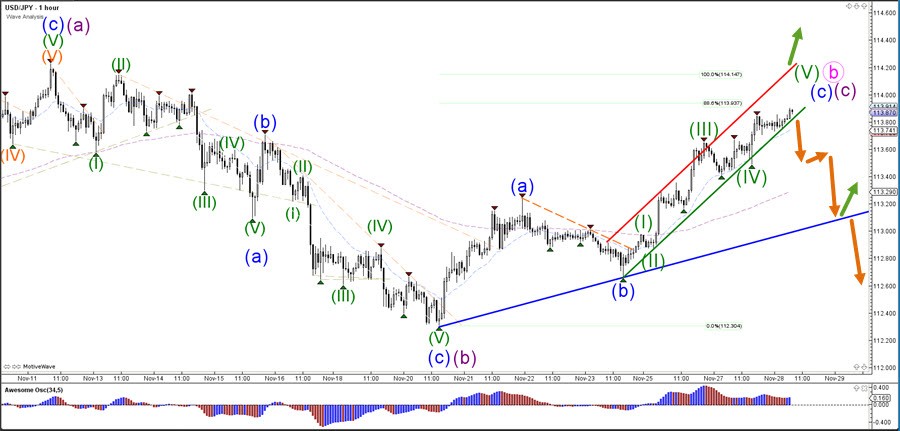
The USD/JPY is either showing a wave C (blue) as shown in the image or the alternative wave pattern for this bullish momentum could be a wave 3. A bearish bounce at the 88.6% Fib and break below the uptrend channel could indicate the end of the wave 5 (green) of wave C (blue) and the start of a bearish swing.

admiral
admiralhttps://www.elitecurrensea.com/
Elite CurrenSea Accessible Forex Trading Systems & Education With over 30 years of combined trading experience, we design, test, and provide successful Forex, CFDs & Crypto trading systems and solutions for retail and institutional traders alike.

Featured Analysis

Learn Forex Trading