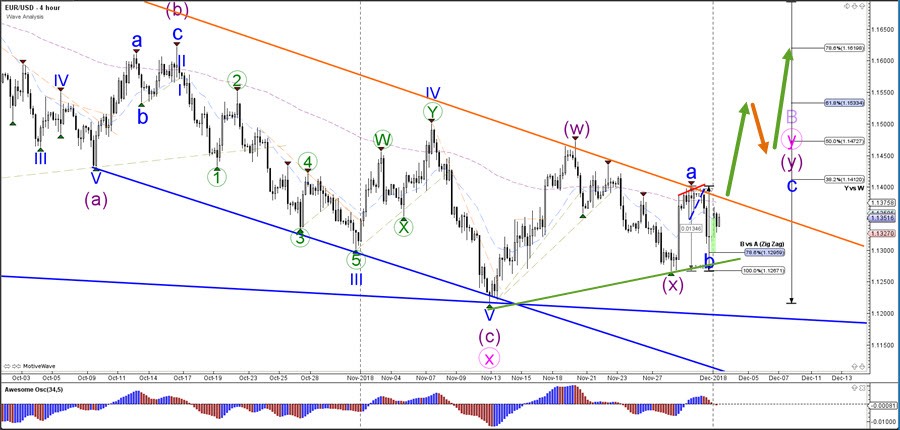
The EUR/USD bullish break above the bearish channel could confirm the bullish wave C (blue) of a larger ABC zigzag pattern. Price could move up to test the Fibonacci retracement levels. A bearish break below the support trend line (green) and 100% Fibonacci level invalidates the ABC (blue) and indicates a deeper retracement within wave X (purple).
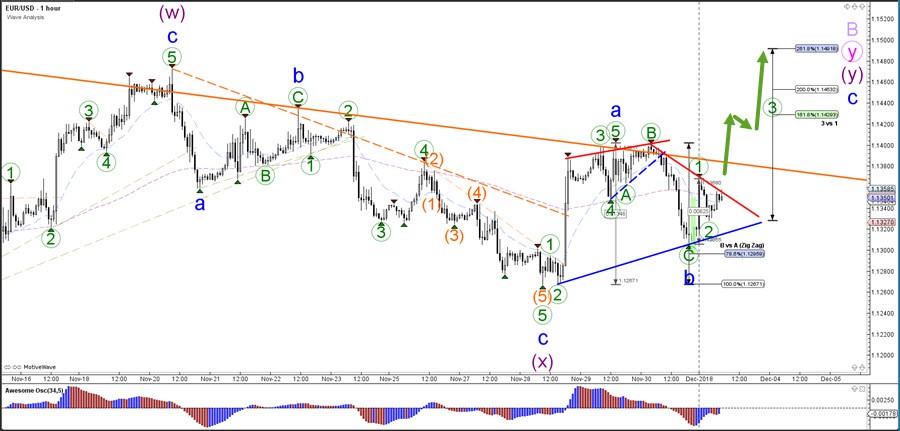
The EUR/USD broke below the support trend line (dotted blue) of the rising wedge reversal chart pattern, which seems to have completed a bearish ABC (green) zigzag within waveB (blue). The bullish bounce could be a wave 1-2 (green) pattern as long as price stays above the support line (blue).