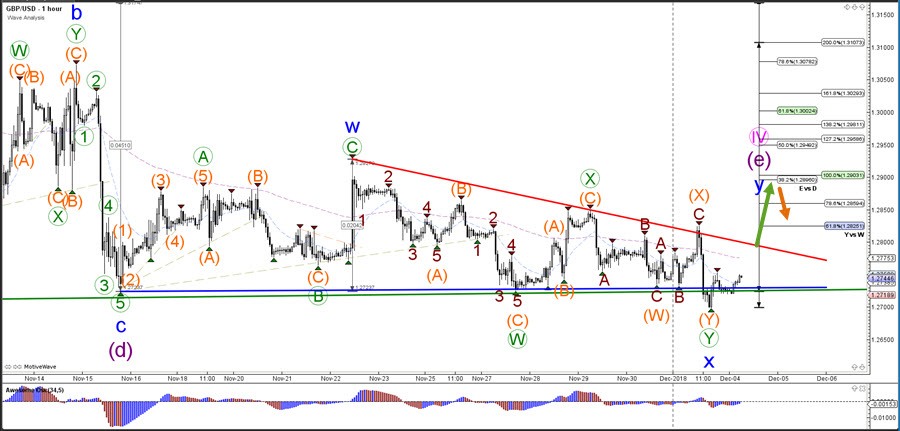
The GBP/USD needs to break above the resistance trend lines (red) to confirm the potential wave Y (blue) correction within the triangle pattern. A bearish break below the support trend lines (green/blue) could indicate a different and bearish wave pattern.
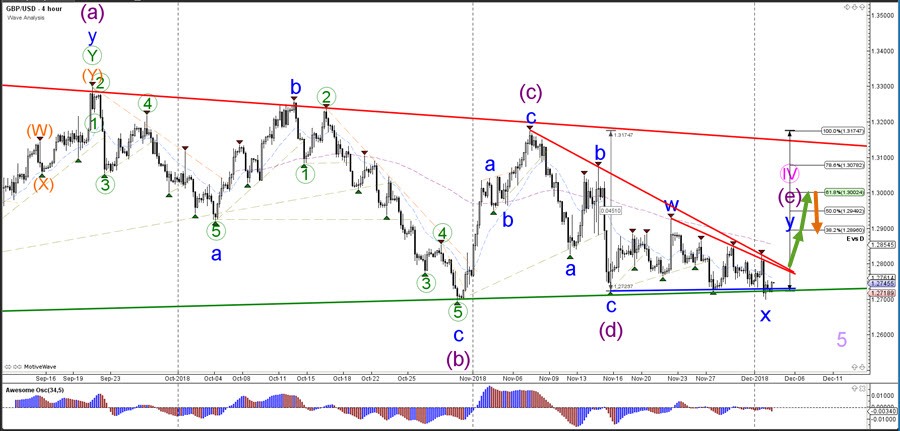
The GBP/USD has been moving up and down between the support and resistance levels of 1.27-1.29 and the sideways price action has created many complex corrections. The chart and wave patterns are indicating that more upside is likely towards the Fibonacci targets.