The AUD/NZD currency pair has been tended south since the middle of August when it made a U-turn from the upper boundary a dominant descending channel pattern at 1.1150.
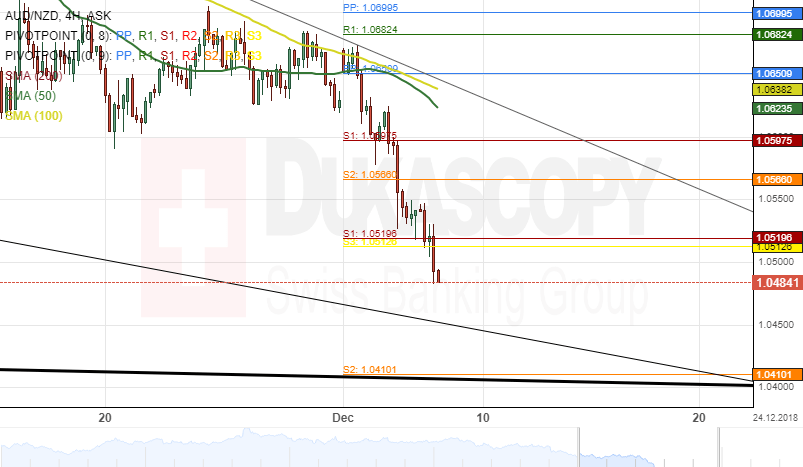
The general direction is expected to remain south within the scope of the following week. Two important levels to watch out for are the lower boundary of a four-month descending channel at 1.0410 and the monthly S2 at 1.0230.
Furthermore, technical indicators suggest that this decline might not happen immediately, as some upside pressure is likely to push the currency exchange rate towards a resistance level at 1.0630.