
The EUR/USD currency pair
Technical indicators of the currency pair:
Prev Open: 1.13552
Open: 1.13160
% chg. over the last day: -0.30
Day’s range: 1.13148 – 1.13340
52 wk range: 1.1214 – 1.2557
The EUR/USD keep having a negative dynamic. The demand on the USD remains due to recovery of the US Treasury bonds yield and positive reports. The EUR is consolidating. The local support and resistance are 1.13100 and 1.13350. The trading instrument can descend further. Investors expect important stats from the US.
The Economic News Feed for 12.12.2018:
Inflation Report (US) – 12:00 (GMT+2:00);
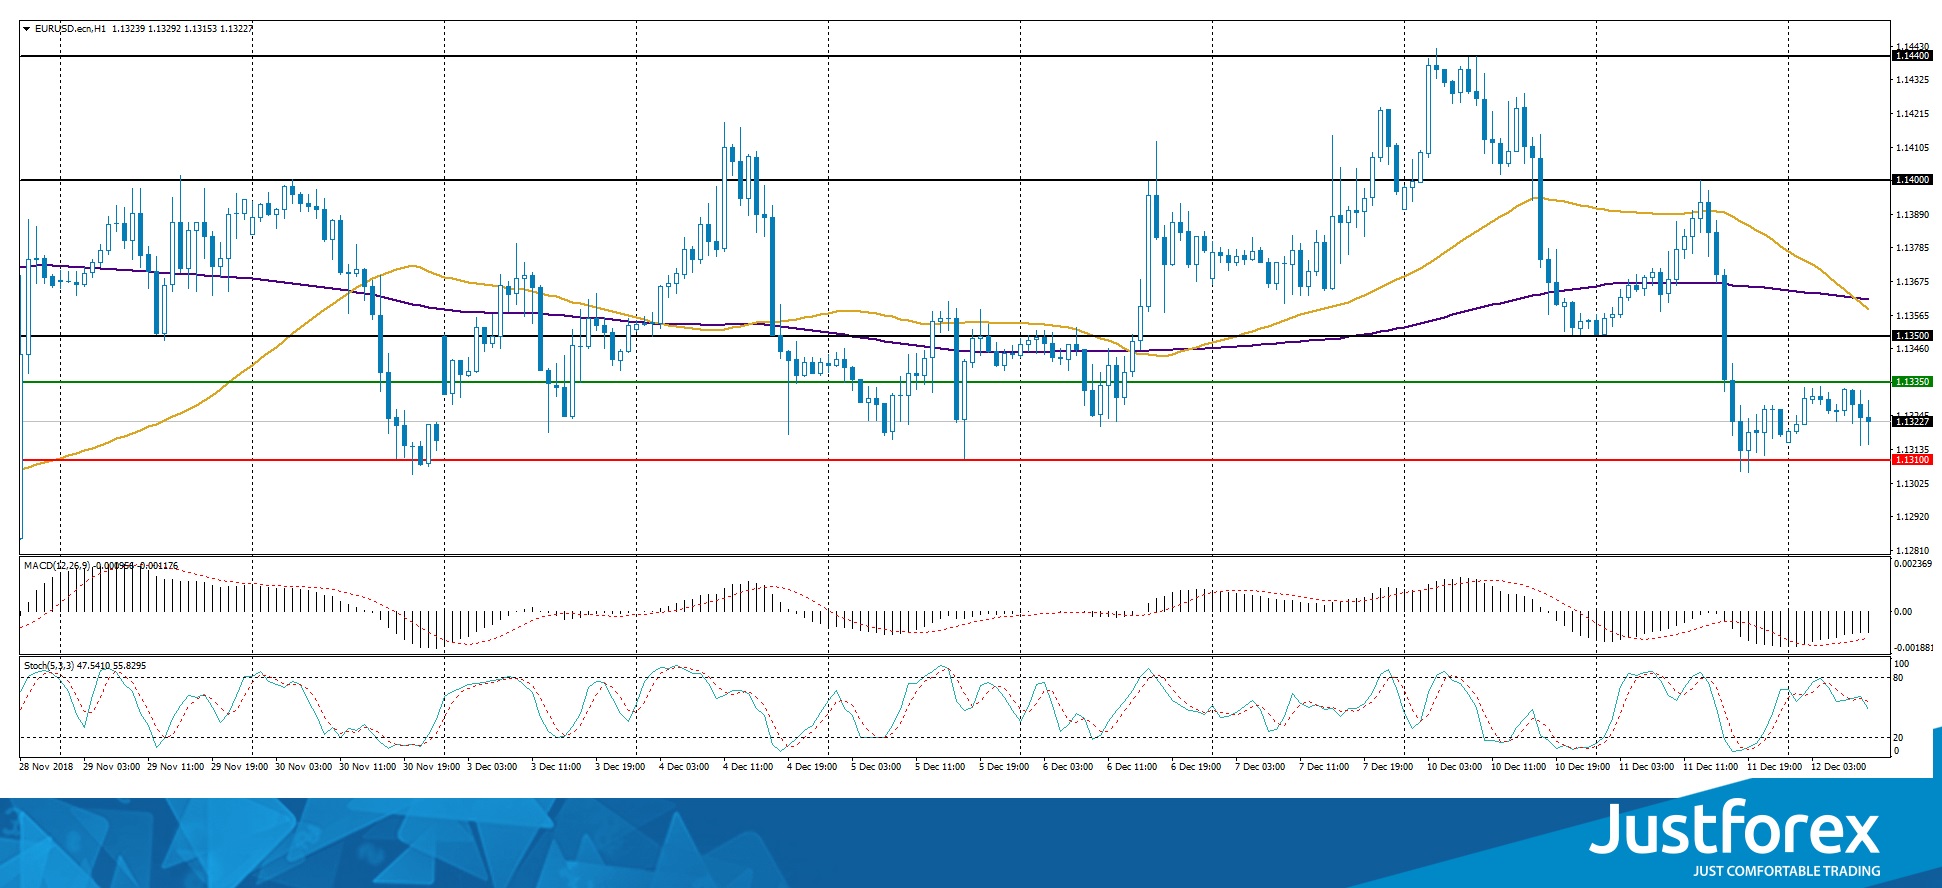
The price fixed below 50 MA and 200 MA which indicates the power of the buyers.
MACD is in the negative zone but above the signal line, which gives a weak signal to sell EUR/USD.
The Stochastic Oscillator is in the neutral zone, the %K line is below the %D line, which indicates a bearish mood.
Trading recommendations
Support levels: 1.13100, 1.12800, 1.12500
Resistance levels: 1.13350, 1.13700, 1.14000
If the price fixes below the support 1.13100, expect further descend towards 1.12800-1.12500.
Alternatively, the quotes can recover toward 1.13500-1.13750.
The GBP/USD currency pair
Technical indicators of the currency pair:
Prev Open: 1.25557
Open: 1.24846
% chg. over the last day: -0.55
Day’s range: 1.24763 – 1.25497
52 wk range: 1.2510 – 1.4378
GBP/USD keeps falling. The trading instrument updated the local minimums. GBP remains under pressure due to the Brexit conundrum after Theresa May cancelled the vote regarding the country leaving the EU. We recommend you keep an eye on the issue. The quotes are consolidating around 1.24850-1.25400.
The News Feed is calm for today.
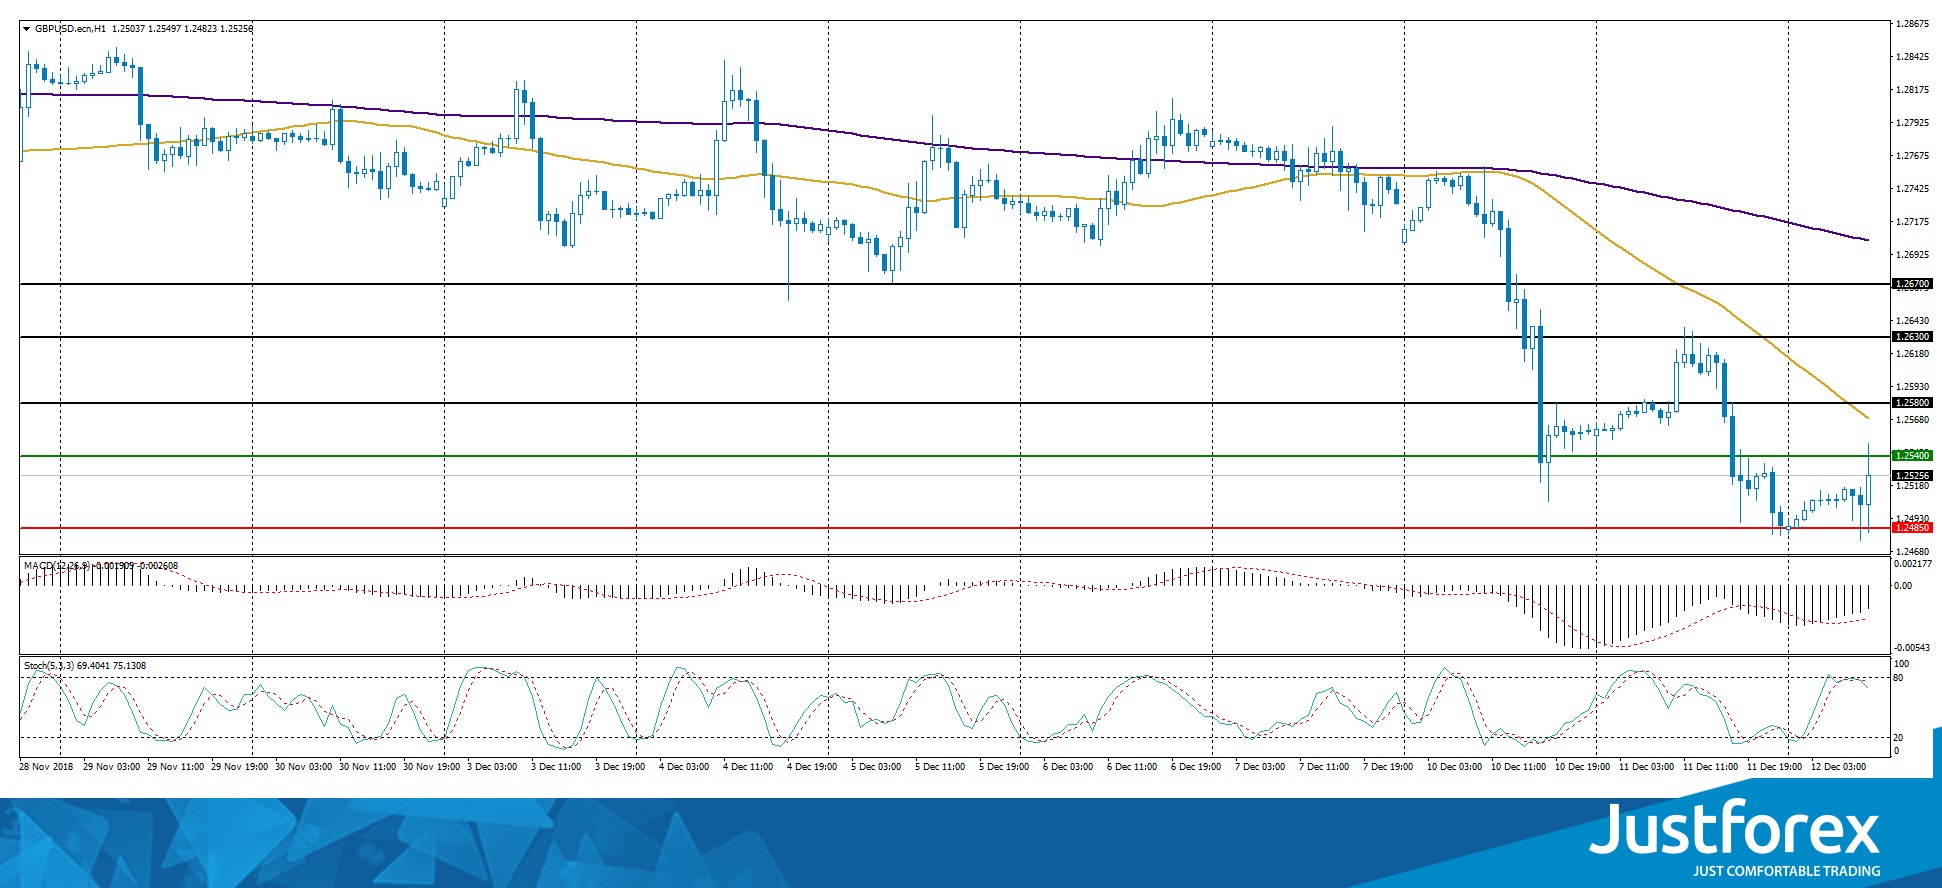
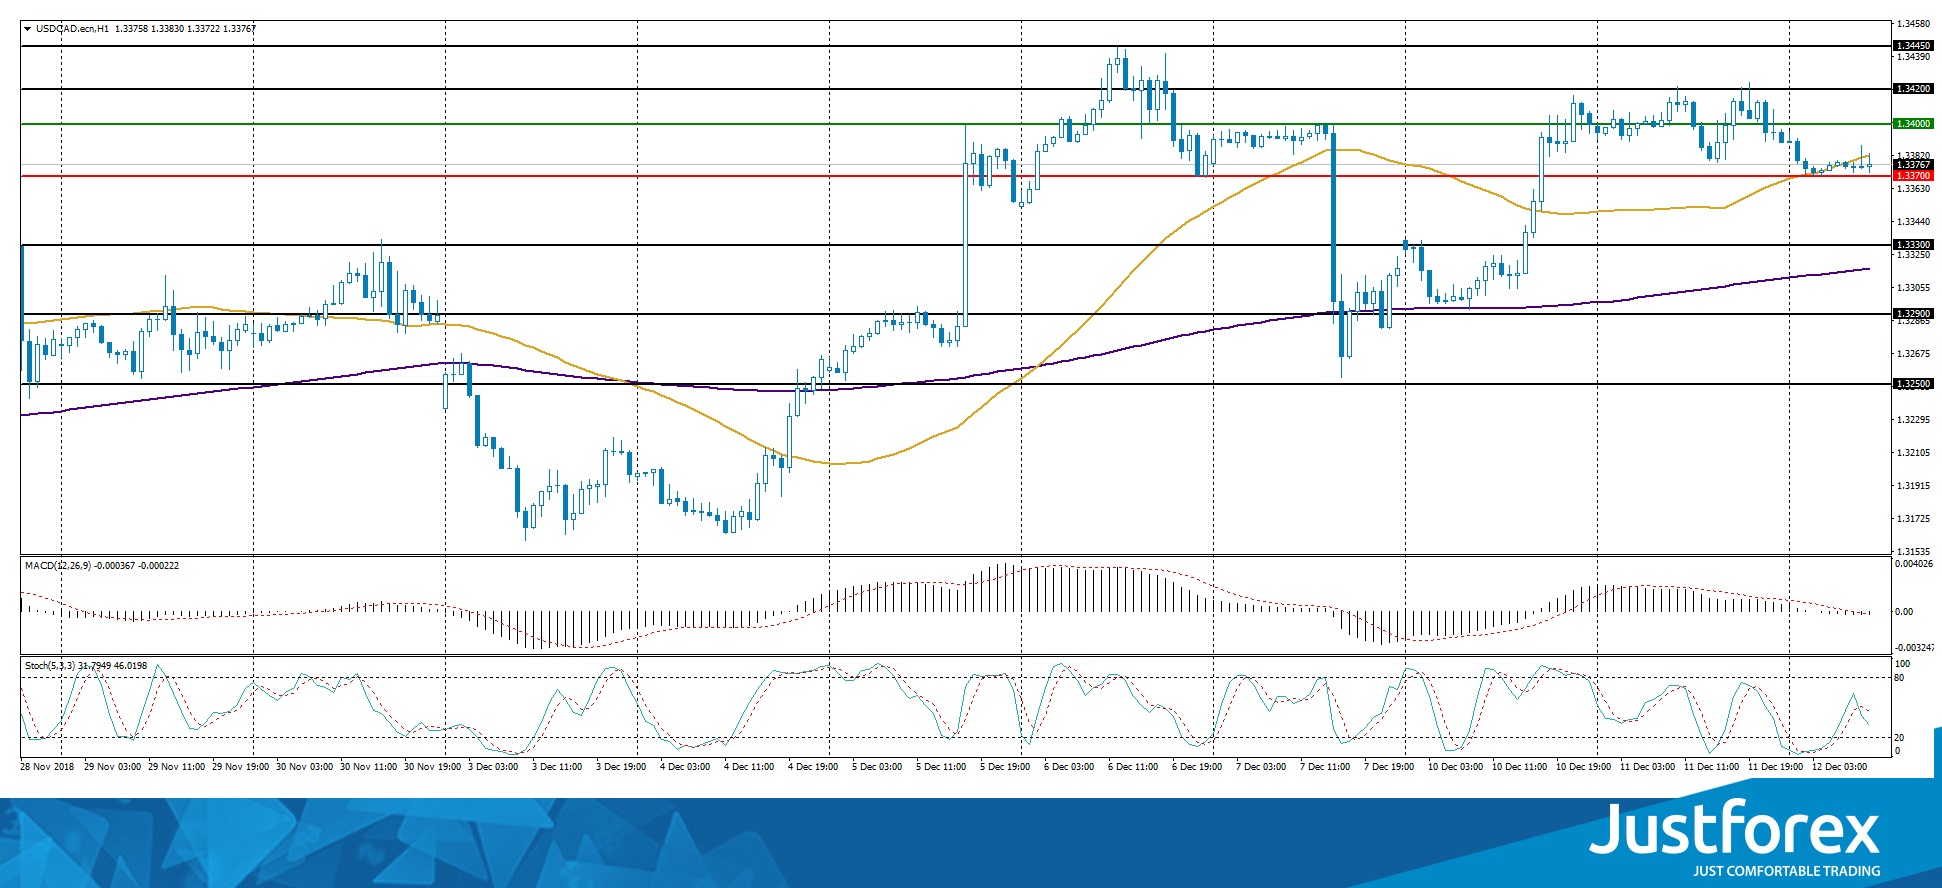
The indicators do not provide singals: the price has crossed 50 MA.
The MACD histogram is around 0.
The Stochastic Oscillator is in the neutral zone, the %K line is below the %D line, which points towards the decline of the USD/CAD quotes.
Trading recommendations
Support levels: 1.33700, 1.33300, 1.32900
Resistance levels: 1.34000, 1.34200, 1.34450
If the price fixes above 1.34000, further growth of the USD/CAD quotes is expected. The movement is tending to 1.34300-1.34500.
Alternative option. If the price fixes below 1.33700, we recommend looking for market entry points to open short positions. The movement is tending to 1.33300-1.33000.
The USD/JPY currency pair
Technical indicators of the currency pair:
Prev Open: 113.317
Open: 113.364
% chg. over the last day: +0.04
Day’s range: 113.309 – 113.516
52 wk range: 104.56 – 114.56
USD/JPY is consolidating around 113.500. 113.250 is the mirror support. The trading instrument has prospects for growth. The financial market participants expect reports from the US and new data regarding the Treasury bond yield. Positions should be opened from the key levels.
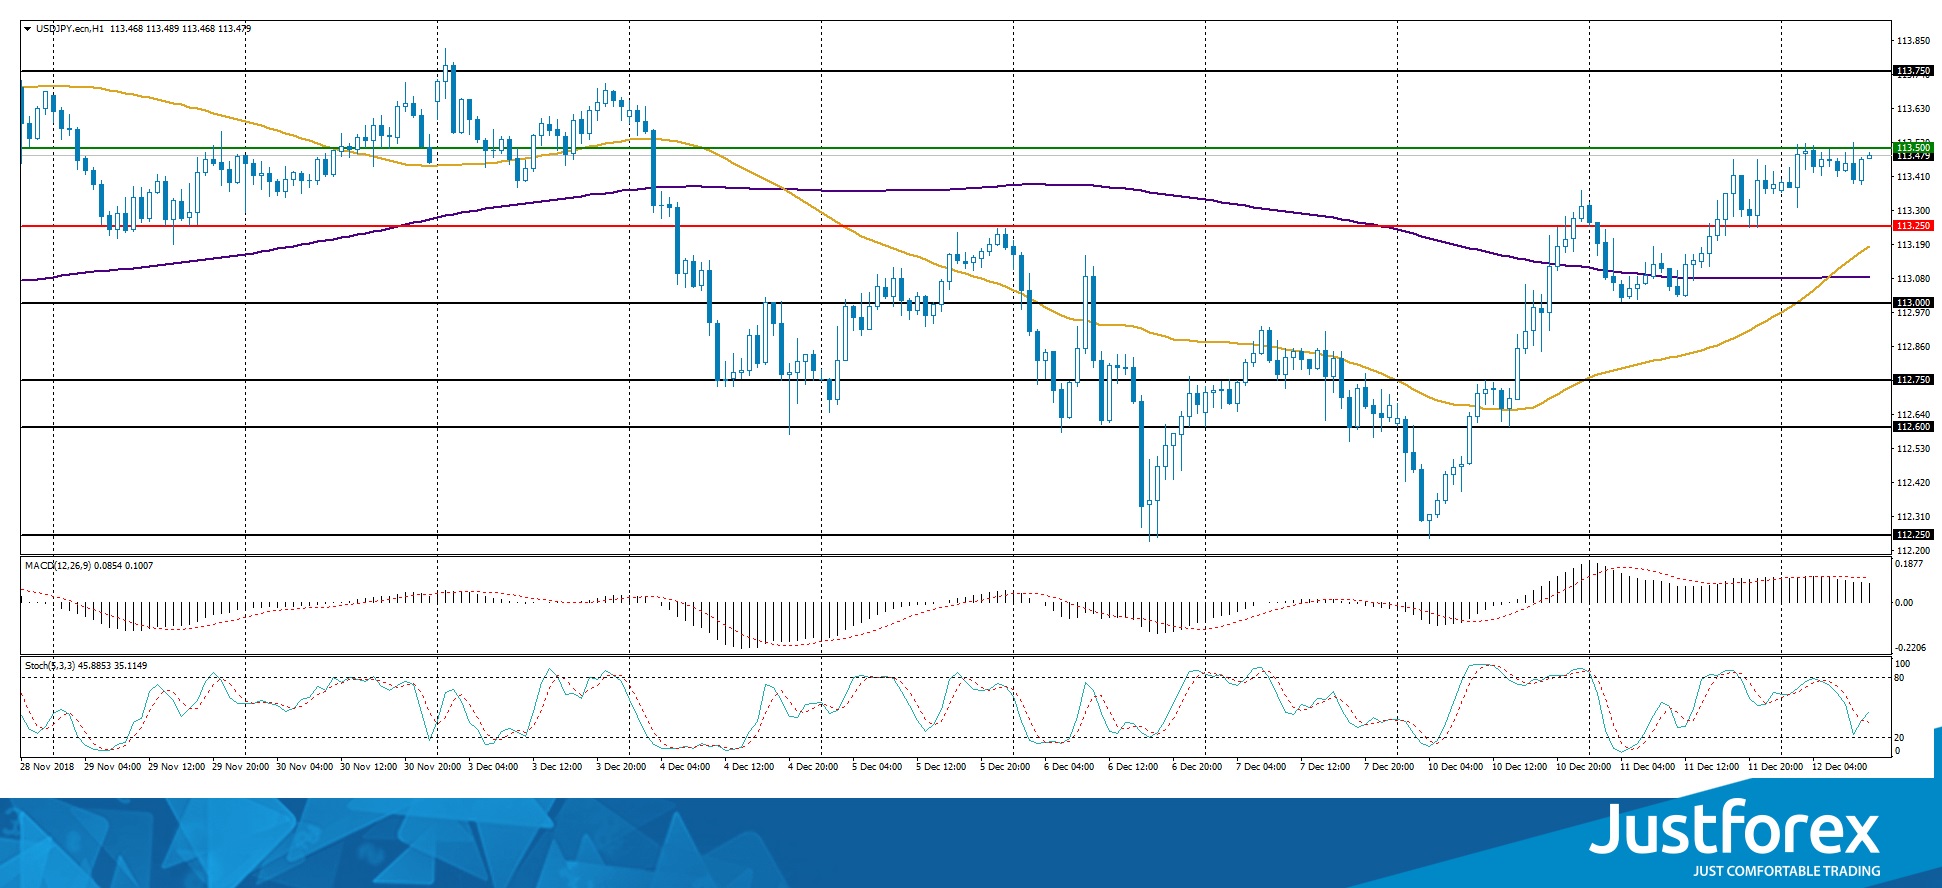
The price has crossed the 200 MA and 50 MA which points towards a bullish mood.
The MACD histogram is in the positive zone but below the signal line, which gives a weak signal to buy USD/JPY.
The Stochastic Oscillator is in the neutral zone, the %K line crosses the %D line. There are no signals at the moment.
Trading recommendations
Support levels: 113.250, 113.000, 112.750
Resistance levels: 113.500, 113.750
If the price fixes above the support level of 113.500,, it is necessary to consider buying USD/JPY. The movement is tending to 113.750-114.000.
An alternative could be the descend of the USD/JPY quotes to 113.000.


