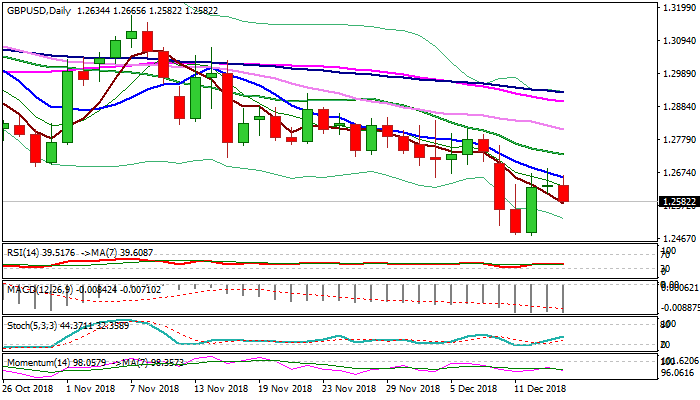
Cable holds in red in early European trading on Friday and eases below 1.26 handle, after recovery rally from 1.2476 (12 Dec low) was repeatedly capped by falling 10SMA (Thursday / today).
Long upper shadows on candles of last three days suggest that recovery is lacking strength for further extension higher, wit reversal pattern forming on daily chart, following Thursday’s Doji candle with long upper shadow and fresh easing today.
Bearish momentum is strengthening on daily chart and MA’s head south in full bearish setup, maintaining pressure.
Fresh weakness pressures hourly cloud base (1.2573), break of which would generate further bearish signal, as there are no obstacles on the way towards key near-term support at 1.2476 (new 20-month low).
Fears of no-deal Brexit maintain bearish sentiment and add to negative outlook.
Violation of 1.2476 support would open way for extension towards 1.2365 (07 Apr 2017 low), while lift and close above falling 10SMA (1.2658) would ease immediate downside risk.
Res: 1.2658, 1.2686, 1.2731, 1.2811
Sup: 1.2573, 1.2556, 1.2476, 1.2395