
The EUR/USD currency pair
Technical indicators of the currency pair:
Prev Open: 1.13731
Open: 1.14451
% chg. over the last day: +0.69
Day’s range: 1.14416 – 1.14729
52 wk range: 1.1214 – 1.2557
The EUR/USD is showing a positive trend. The quotes grew by 80 points and set the new monthly maximums. The USD is under pressure due to weak economic reports and political stress in the White House. Donald Trump refused to sign a bill regarding the temporary financing of the government. The Philadelphia PMI in December lowered to 9.4 instead of 15.6. You should open positions from the key levels of 1.14400-1.14800.
The Economic News Feed for 21.12.2018:
Primary Orders on the Durable Goods (US) – 15:30 (GMT+2:00);
GDP Report (US) – 15:30 (GMT+2:00);
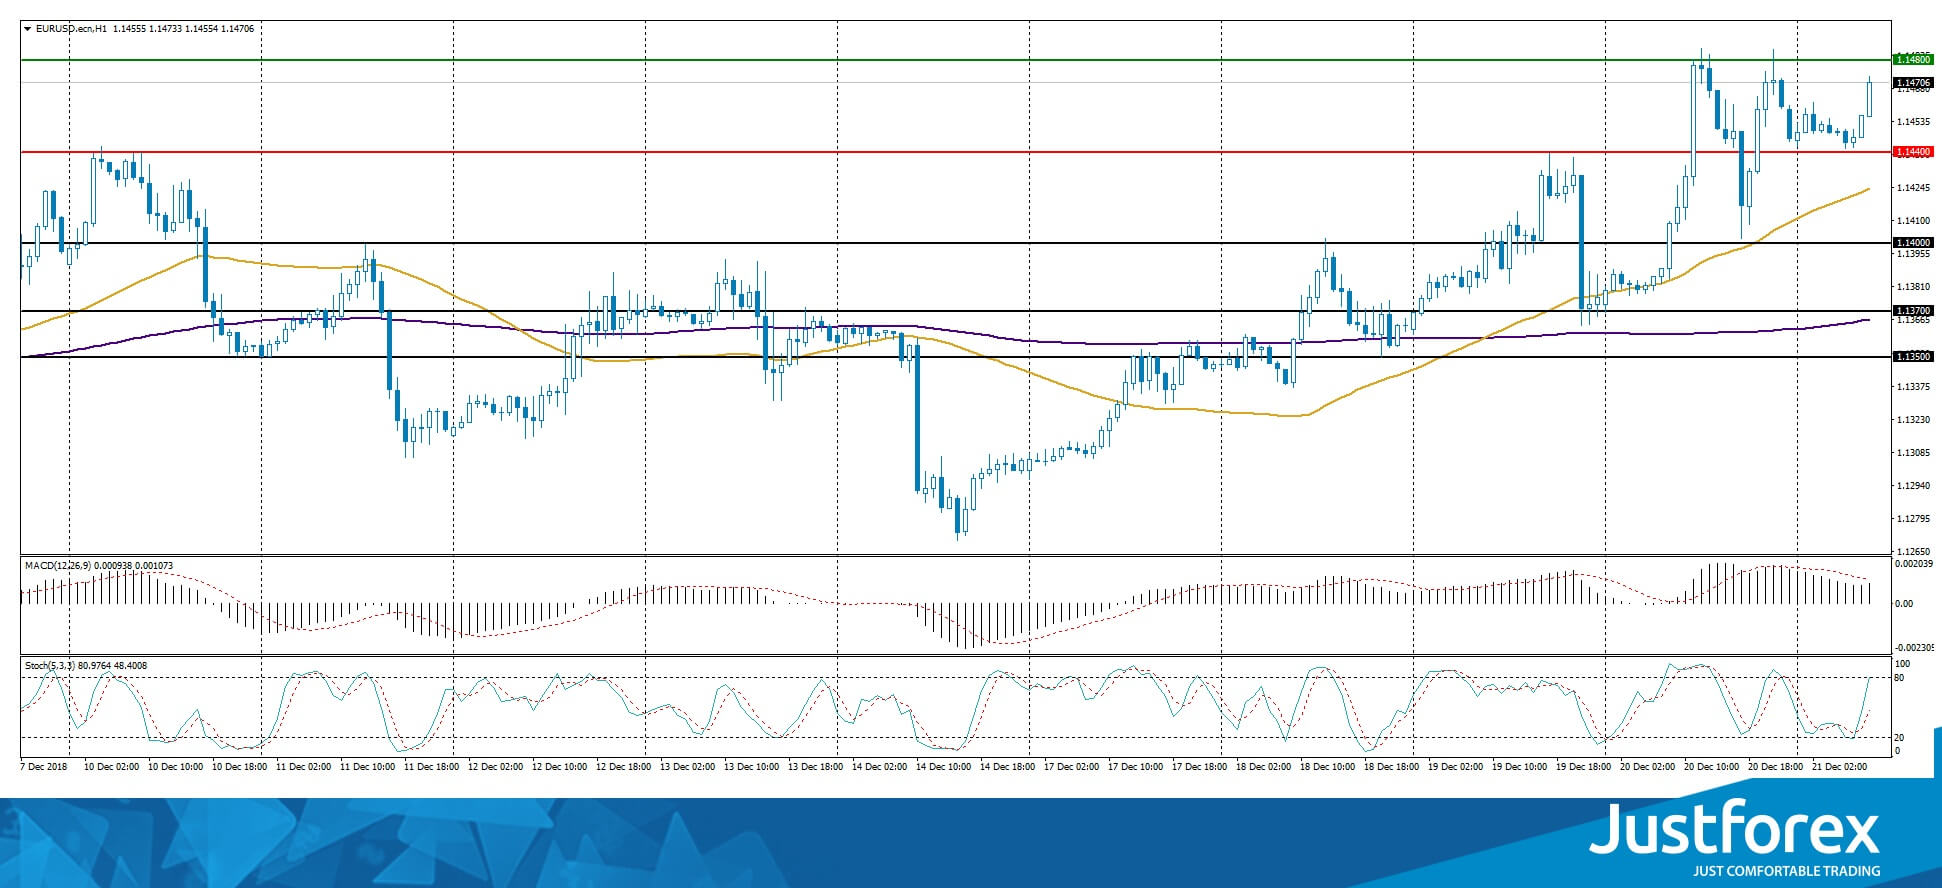
Inficators signal the power of the buyers, the price fixed above 50 MA and 200 MA.
The MACD histogram is in the positive zone and keeps rising which points toward the growth of the EUR/USD.
The Stochastic Oscillator is in the neutral zone, the %K line is above the %D line, which also gives a signal to buy EUR/USD.
Trading recommendations
Support levels: 1.14400, 1.14000, 1.13700
Resistance levels: 1.14800, 1.15000
If the price fixes above 1.14800 expect further growth of the EUR/USD toward 1.15000-1.15300.
Alternatively the quotes can descend toward 1.14000.
The GBP/USD currency pair
Technical indicators of the currency pair:
Prev Open: 1.26079
Open: 1.26532
% chg. over the last day: +0.47
Day’s range: 1.26398 – 1.26976
52 wk range: 1.2477 – 1.4378
The GBP/USD keeps trading in a long flat. The technical picture is ambiguous. The Bank of England, as expected, kept the monetary policy at the same levels. The GBP is supported by the positive retail sales report in the UK. The investors are looking forward to more data regarding Brexit. The key trading range is 1.26350-1.26800, positions should be opened from these levels.
At 11:30 (GMT+2:00) the UK will publish a GDP report.
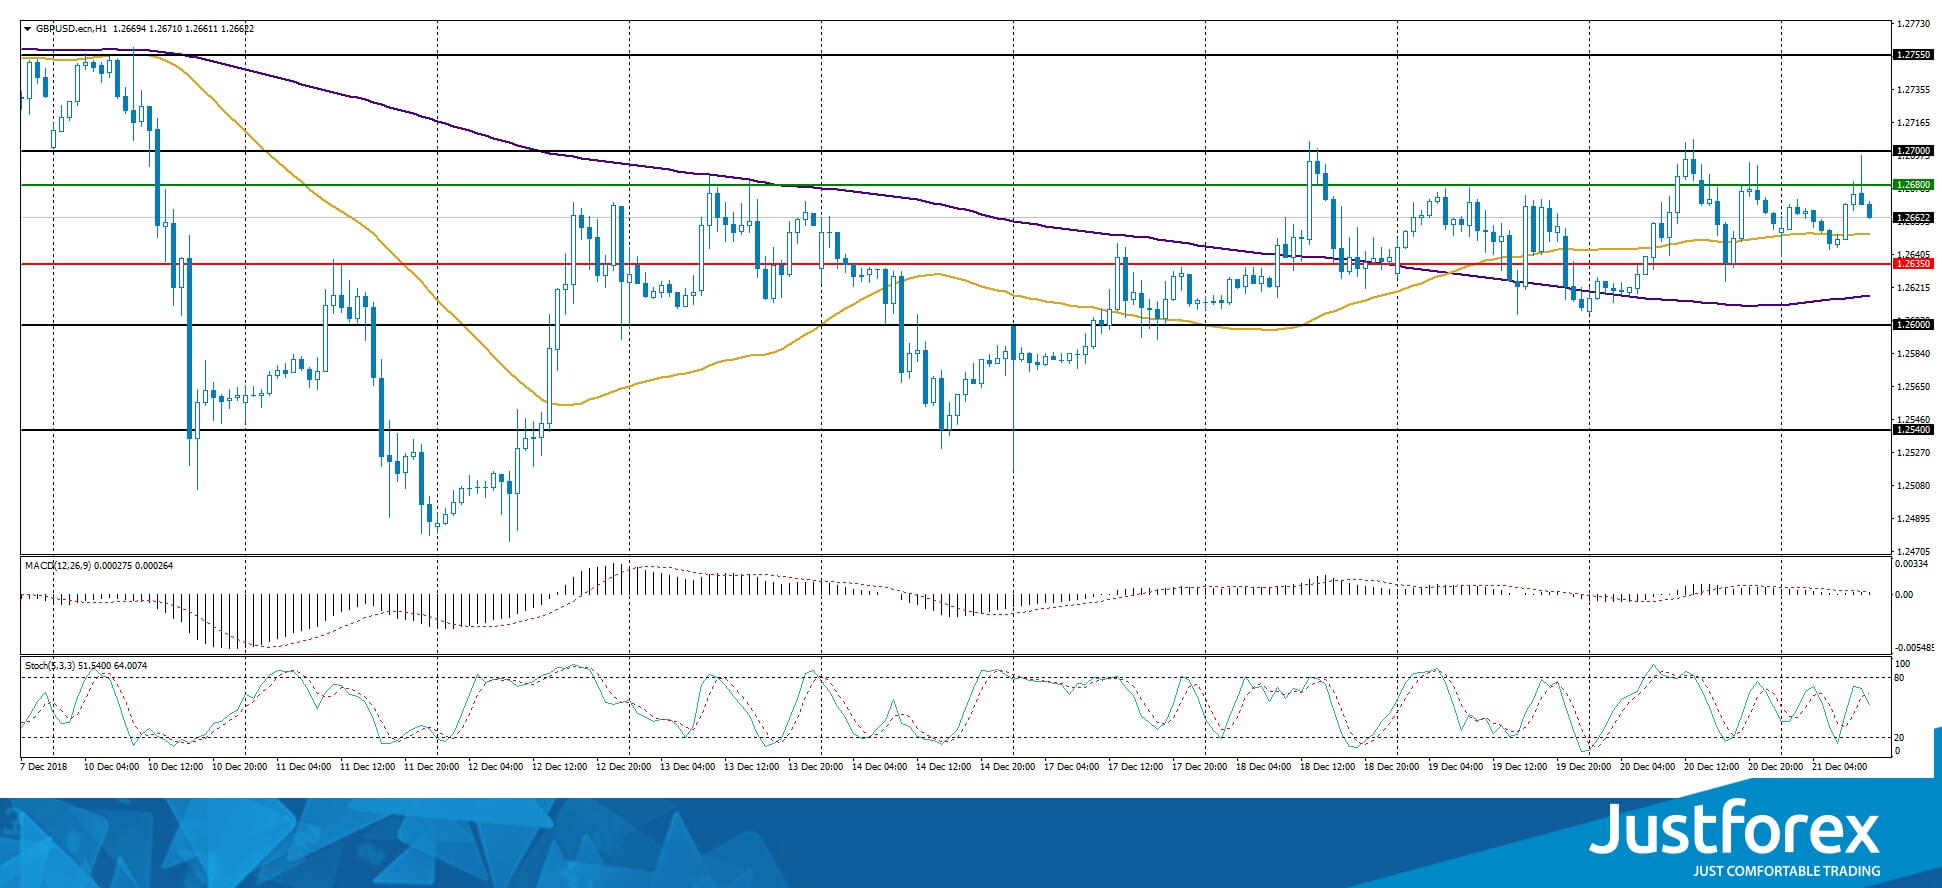
Indicators do not provide precise signals, 50 MA started to cross 200 MA.
The MACD histogram is close to 0.
The Stochastic Oscillator is in the neutral zone, the %K line is rossing the %D line. There are no signals at the moment.
Trading recommendations
Support levels: 1.26350, 1.26000, 1.25400
Resistance levels: 1.26800, 1.27550, 1.28000
If the price fixes above 1.26800, consider buying GBP/USD. The movement will tend toward 1.27400-1.27750.
Alternatively the quotes can descend toward the round 1.26000.
The USD/CAD currency pair
Technical indicators of the currency pair:
Prev Open: 1.34842
Open: 1.35028
% chg. over the last day: +0.10
Day’s range: 1.34928 – 1.35266
52 wk range:1.2248 – 1.3496
The USD/CAD keeps showing a bullish mood. The CAD is trading in a flat. Positions should be opened from the key interest levels of 1.34900 and 1.35300. Investors are waiting for the economic reports from Canada. Also, keep an eye on the oil quotes dynamics.
The Economic News Feed for 21.12.2018:
Basis Index for Retail Sales (CAD) – 15:30 (GMT+2:00);
GDP Report (CAD) – 15:30 (GMT+2:00);
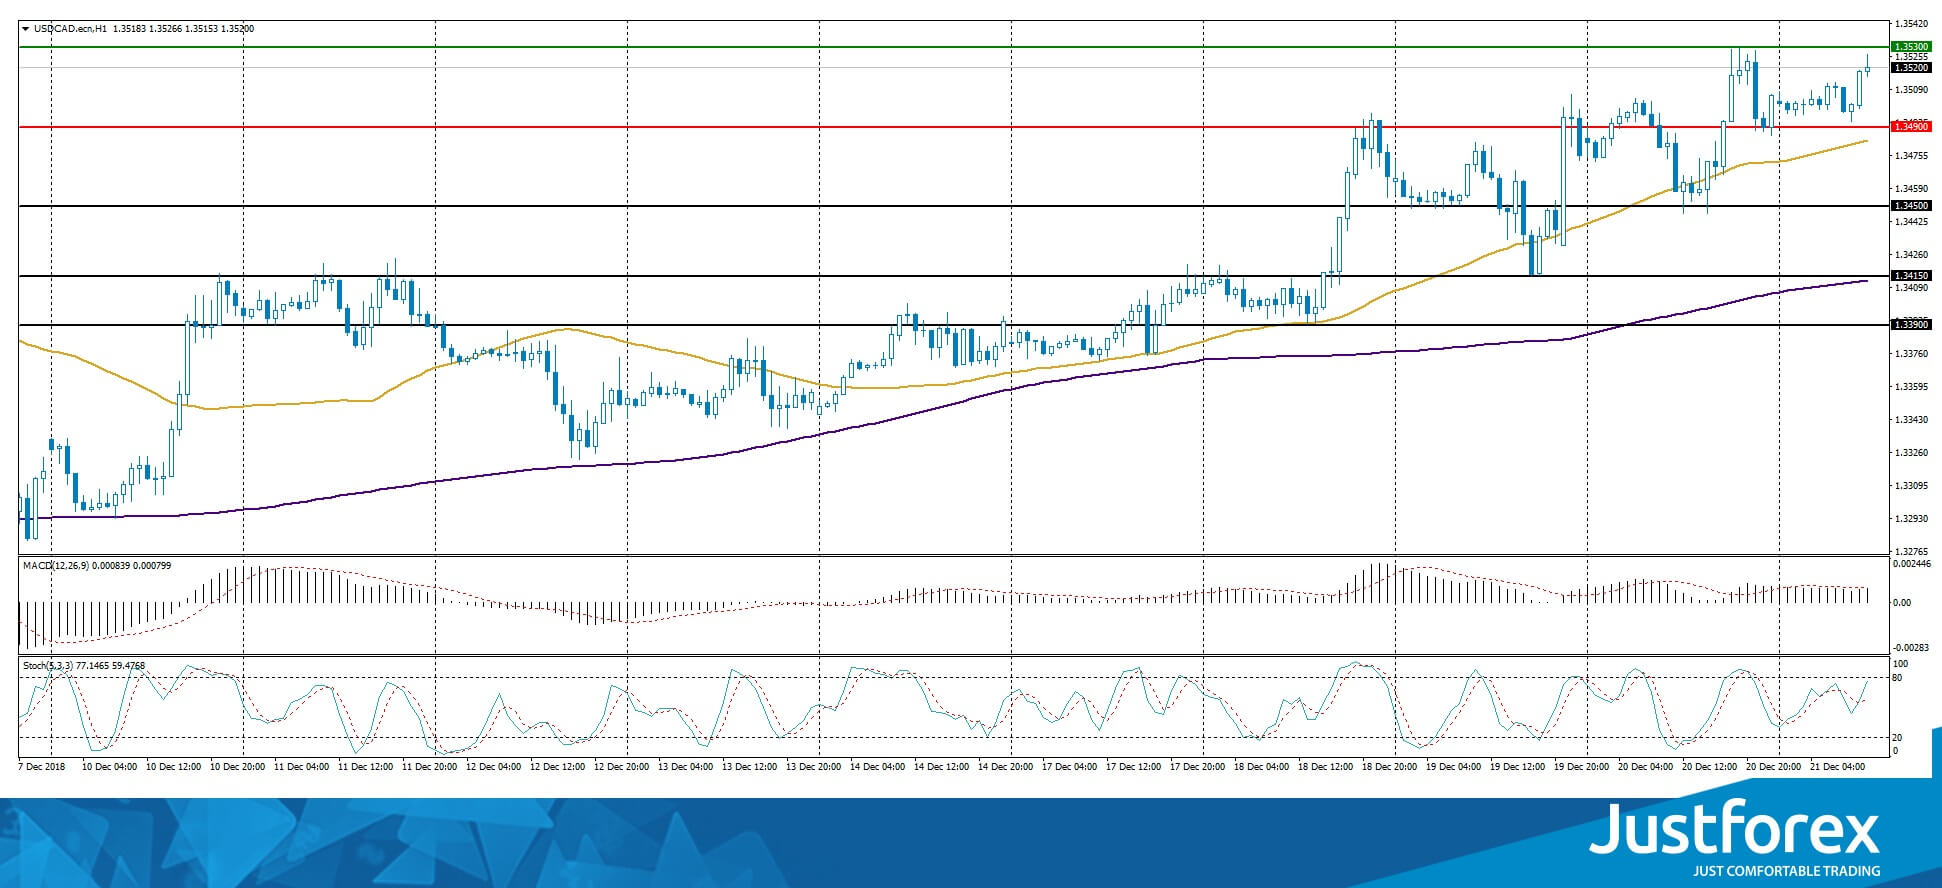
The price fixed above 50 MA and 200 MA which points toward the power of the buyers.
The MACD is in the positive zone and keeps rising which points toward the growth of USD/CAD.
The Stochastic Oscillator is in the neutral zone, the %K line is higher than the %D line, which gives a signal to buy USD/CAD.
Trading recommendations
Support levels: 1.34900, 1.34500, 1.34150
Resistance levels: 1.35300, 1.35500
If the price fixes above 1.35300 expect further growth toward 1.35600-1.35800.
Alternatively the price can fix below 1.34900 and you should expect a drop-off toward 1.34600-1.34400.
The USD/JPY currency pair
Technical indicators of the currency pair:
Prev Open: 112.406
Open: 111.203
% chg. over the last day: -1.16
Day’s range: 111.048 – 111.459
52 wk range: 104.56 – 114.56
USD/JPY remains in an aggressive sell-off. During the trading yesterday, the yen grew by more than 1% against the USD. The quotes reached 111.000 and can descend further. The local resistance is 111.450. You should keep an eye on the US economic reports and the government bond dynamics.
During the Asian trading session, Japan published a weak inflation report.
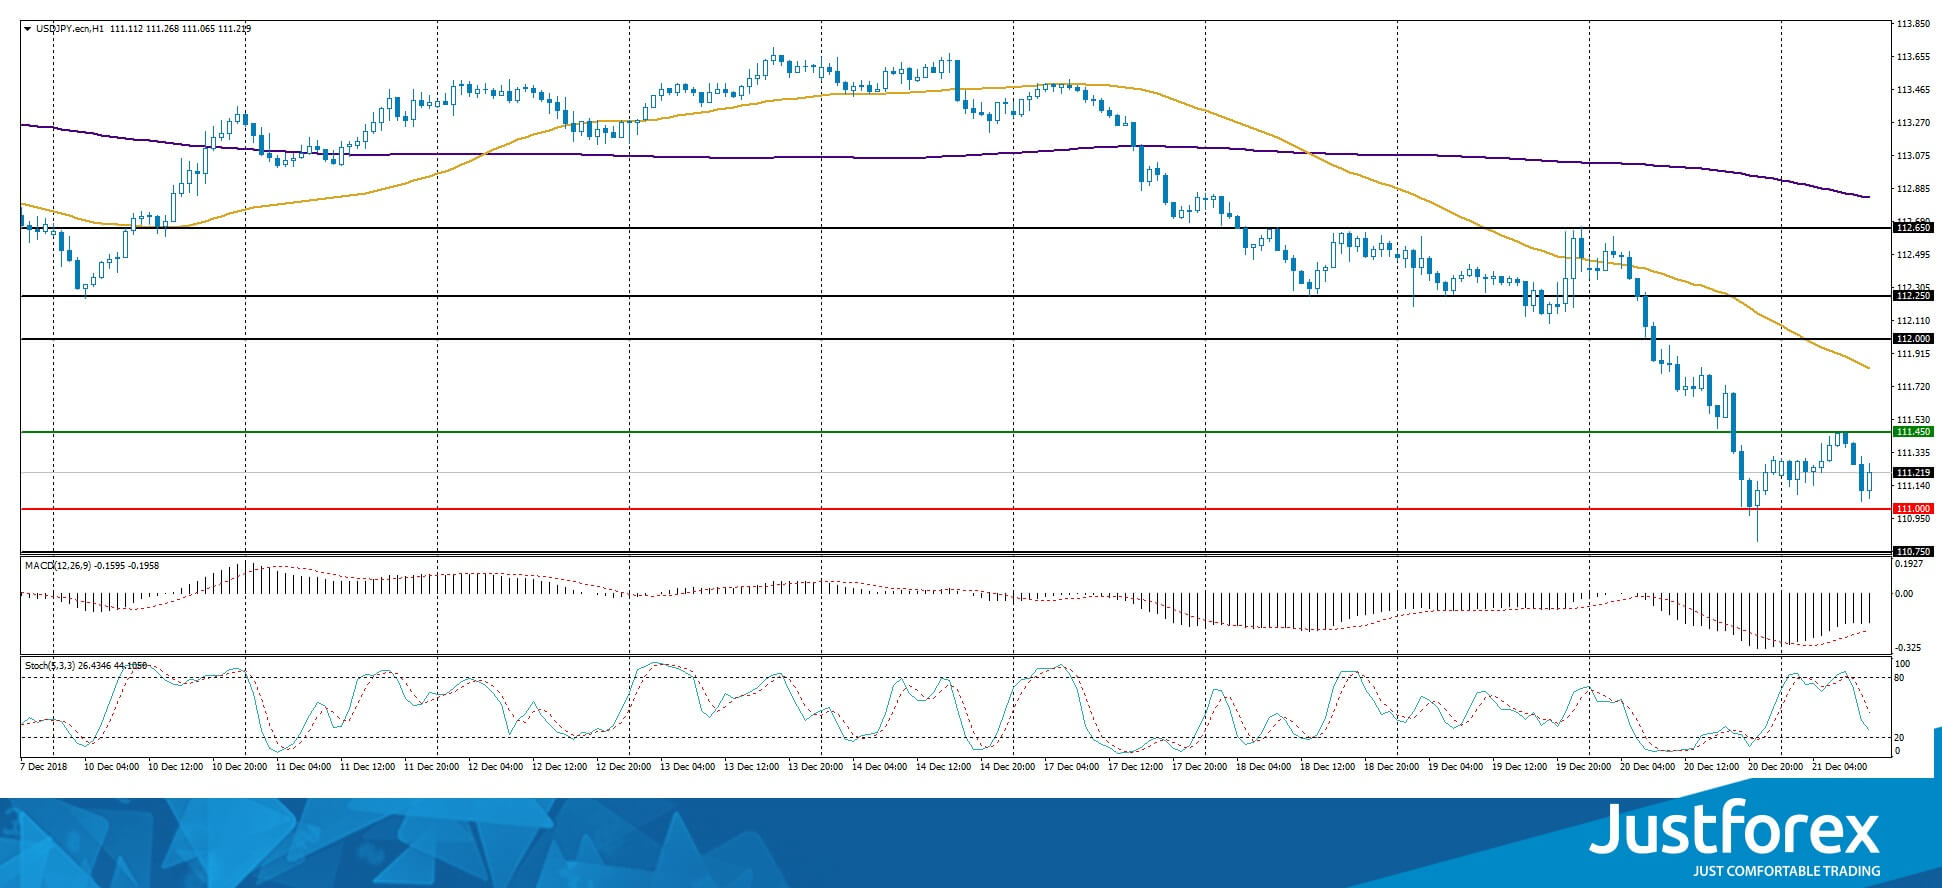
Indicators point toward the power of the buyers: the price fixed below 50 MA and 200 MA.
The MACD histogram is in the negative zone but above the signal line, which gives a weak signal to sell USD/JPY.
The Stochastic Oscillator is in the neutral zone but above the signal line which points toward a bearish sentiment.
Trading recommendations
Support levels: 111.000, 110.750
Resistance levels: 111.450, 112.000, 112.250
If the price fixes below the round 111.000 expect further descend of the USD/JPY quotes..
Alternatively the currency pair can recover toward 111.700-111.900.


