
The EUR/USD currency pair
Technical indicators of the currency pair:
Prev Open: 1.13890
Open: 1.13518
% chg. over the last day: -0.33
Day’s range: 1.13514 – 1.13932
52 wk range: 1.1214 – 1.2557
The EUR/USD technical picture remains ambiguous. The quotes are consolidating, the EUR is testing the local support and resistance levels 1.13700 and 1.14000. The financial market participants are waiting for important stats from the US.
The Economic News Feed for 27.12.2018:
Customer Trust Index (US) – 17:00 (GMT+2:00);
New Real Estate Sales (US) – 17:00 (GMT+2:00).
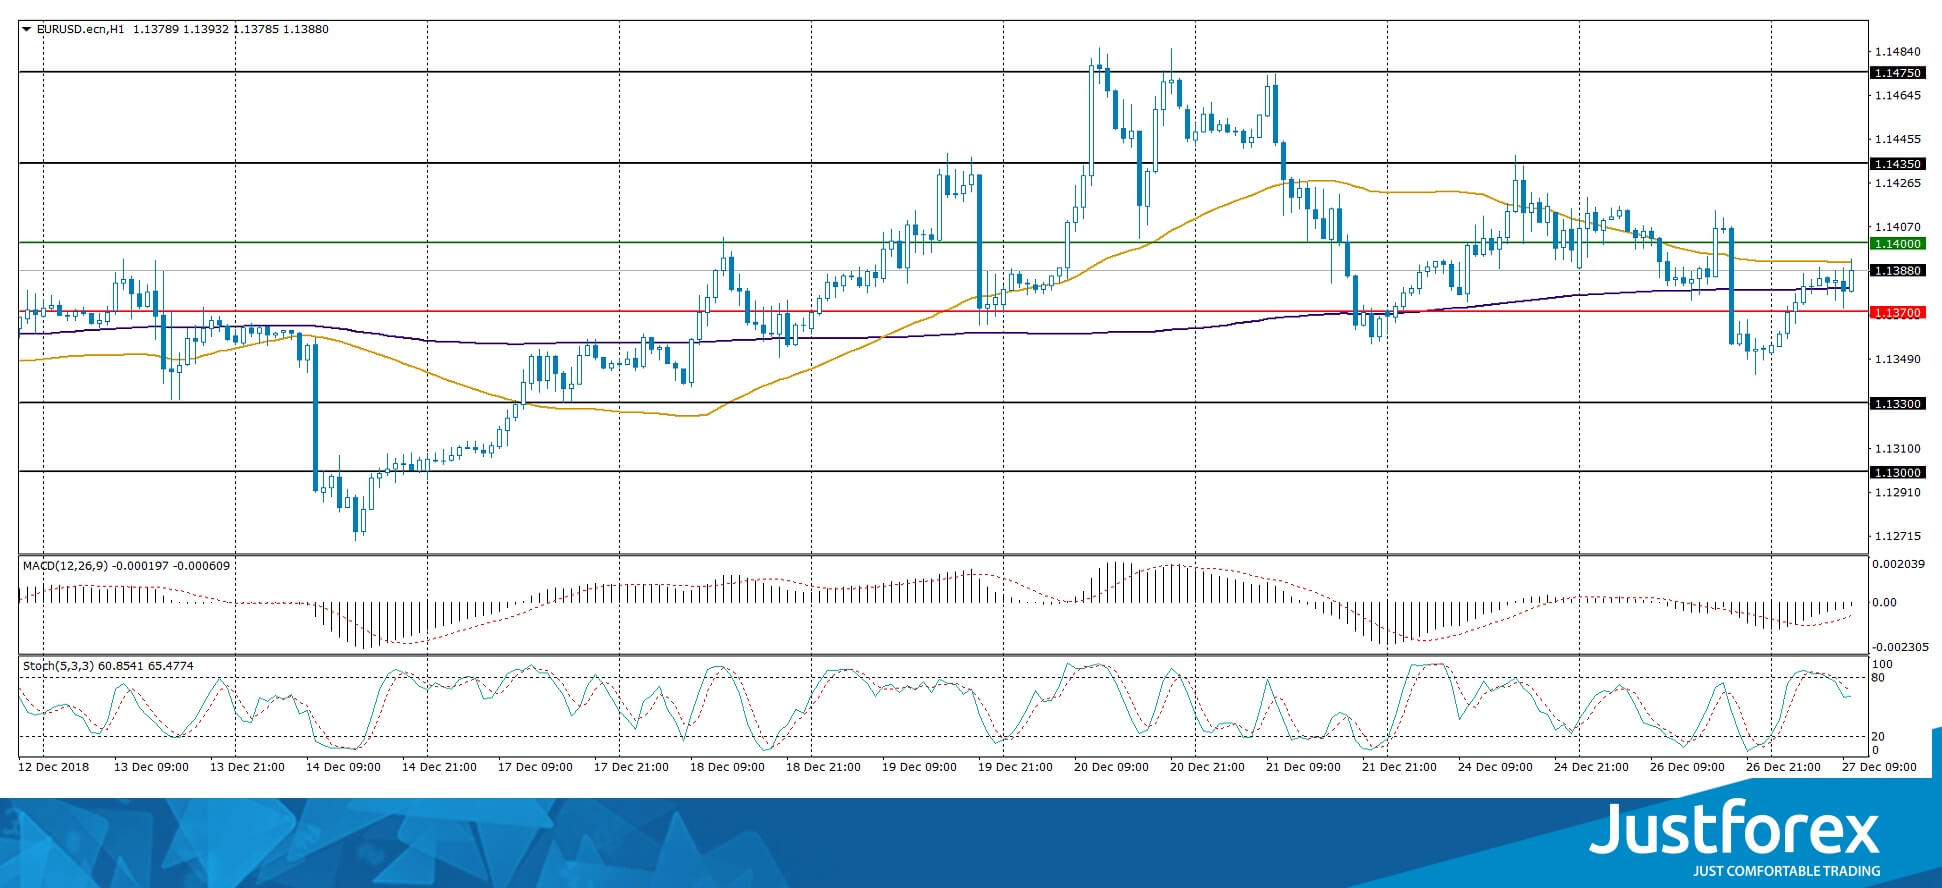
The indicators do not provide precise signals, the price has crossed 50 MA and 200 MA.
The MACD histogram is located close to 0.
The Stochastic Oscillator is in the neutral zone, the %K line is below the %D line, which points toward a bearish sentiment.
Trading recommendations
Support levels: 1.13700, 1.13300, 1.13000
Resistance levels: 1.14000, 1.14350, 1.14750
If the price fixes above the round 1.14000, expect the EUR/USD quotes to grow toward 1.14350-1.14700.
Alternatively the quotes can descend toward 1.13400-1.13200.
The GBP/USD currency pair
Technical indicators of the currency pair:
Prev Open: 1.26602
Open: 1.26311
% chg. over the last day: -0.32
Day’s range: 1.26284 – 1.26665
52 wk range: 1.2477 – 1.4378
The GBP/USD is still being traded in a long flat. There is no single defined trend. The key support and resistance levels are 1.26300 and 1.26750. Positions should be opened from these levels. You should keep an eye on the US news feed.
The Economic News Feed for 27.12.2018 is calm.
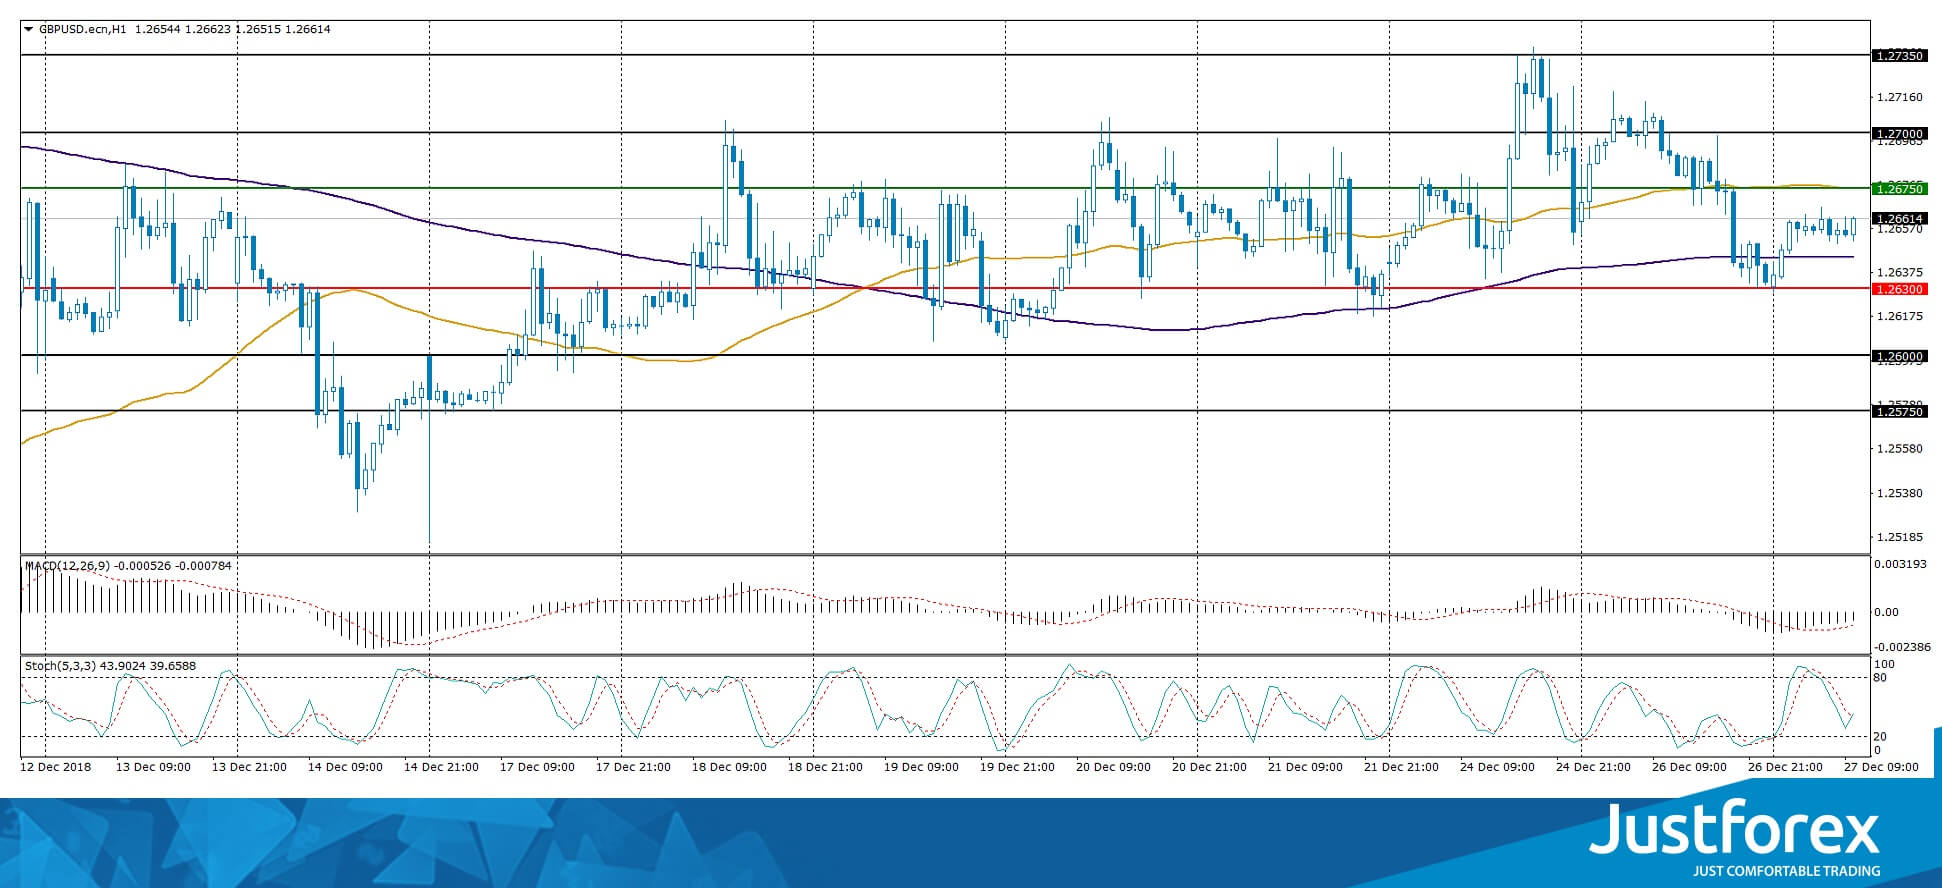
The indicators do not provide precise signals, the price fixed between 50 MA and 200 MA.
The MACD histogram is in the negative zone but above the signal line, which gives a weak signal to sell GBP/USD.
The Stochastic Oscillator is in the neutral zone, the %K line is crossing the %D line. There are no signals yet.
Trading recommendations
Support levels: 1.26300, 1.26000, 1.25750
Resistance levels: 1.26750, 1.27000, 1.27350
If the price fixes above 1.26750, consider buying GBP/USD. The movement will tend toward 1.27000-1.27350.
Alternatively the quotes can descend toward 1.26000-1.25750.
The USD/CAD currency pair
Technical indicators of the currency pair:
Prev Open: 1.35782
Open: 1.35679
% chg. over the last day: -0.11
Day’s range: 1.35662 – 1.36110
52 wk range: 1.2248 – 1.4132
USD/CAD is consolidating after a long rally. There is no singular trend. Luni is testing the key support and resistance levels of 1.32650 and 1.36150. A technical correction is possible soon. Keep an eye on the oil quotes dynamic and open positions from the key levels.
The Economic News Feed for 27.12.2018 is calm.
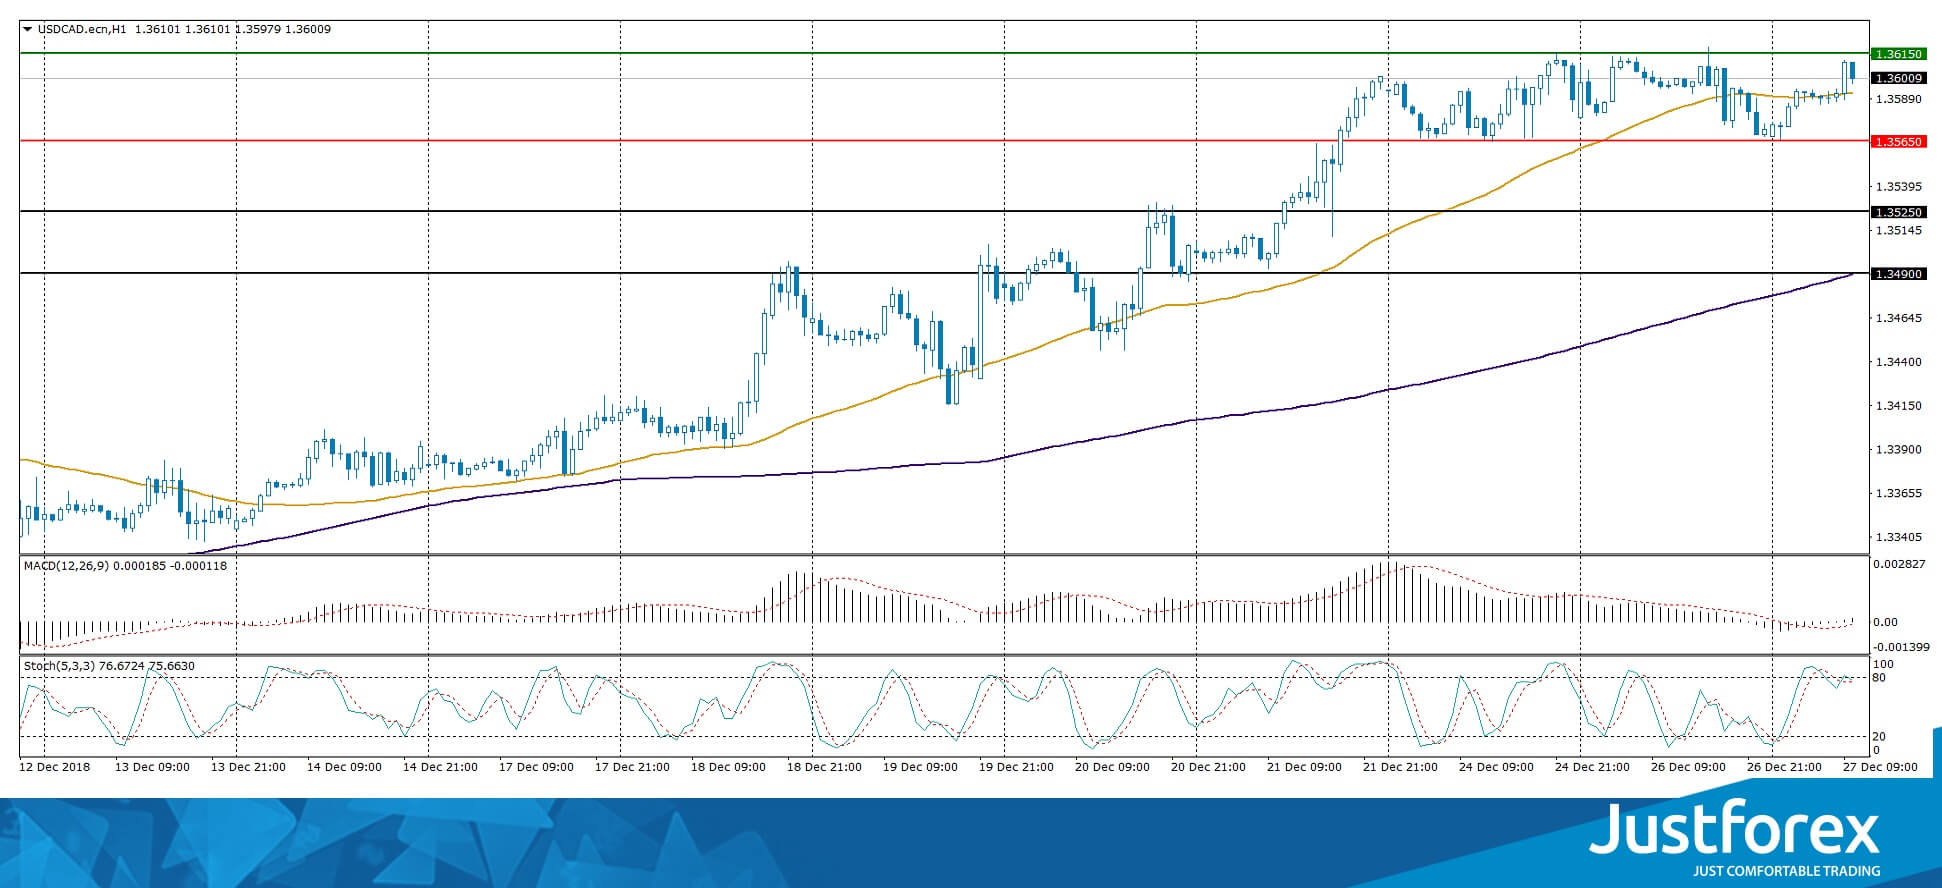
The indicators do not provide precise signals, the price is testing 50 MA.
The MACD histogram is close to 0.
The Stochastic Oscillator is near the overbought zone, the %K line is crossing the %D line. There are no signals at the moment.
Trading recommendations
Support levels: 1.35650, 1.35250, 1.34900
Resistance levels: 1.36150, 1.36500
If the price fixes above the resistance level of 1.36150, expect further growth of the USD/CAD quotes. The movement will tend toward 1.36500-1.36700.
Alternatively the quotes fix below 1.35650 and you should expect a corrective trend toward 1.35300-1.35000.
The USD/JPY currency pair
Technical indicators of the currency pair:
Prev Open: 110.230
Open: 111.301
% chg. over the last day: +0.85
Day’s range: 110.809 – 111.340
52 wk range: 104.56 – 114.56
USD/JPY started to grow after a long descend. Yesterday the quotes grew by 100 points and updated the local maximums. Right now the safe haven currency is consolidating and has good prospects for growth. Positions should be opened from the key levels.
The Economic News Feed for 27.12.2018 is calm.
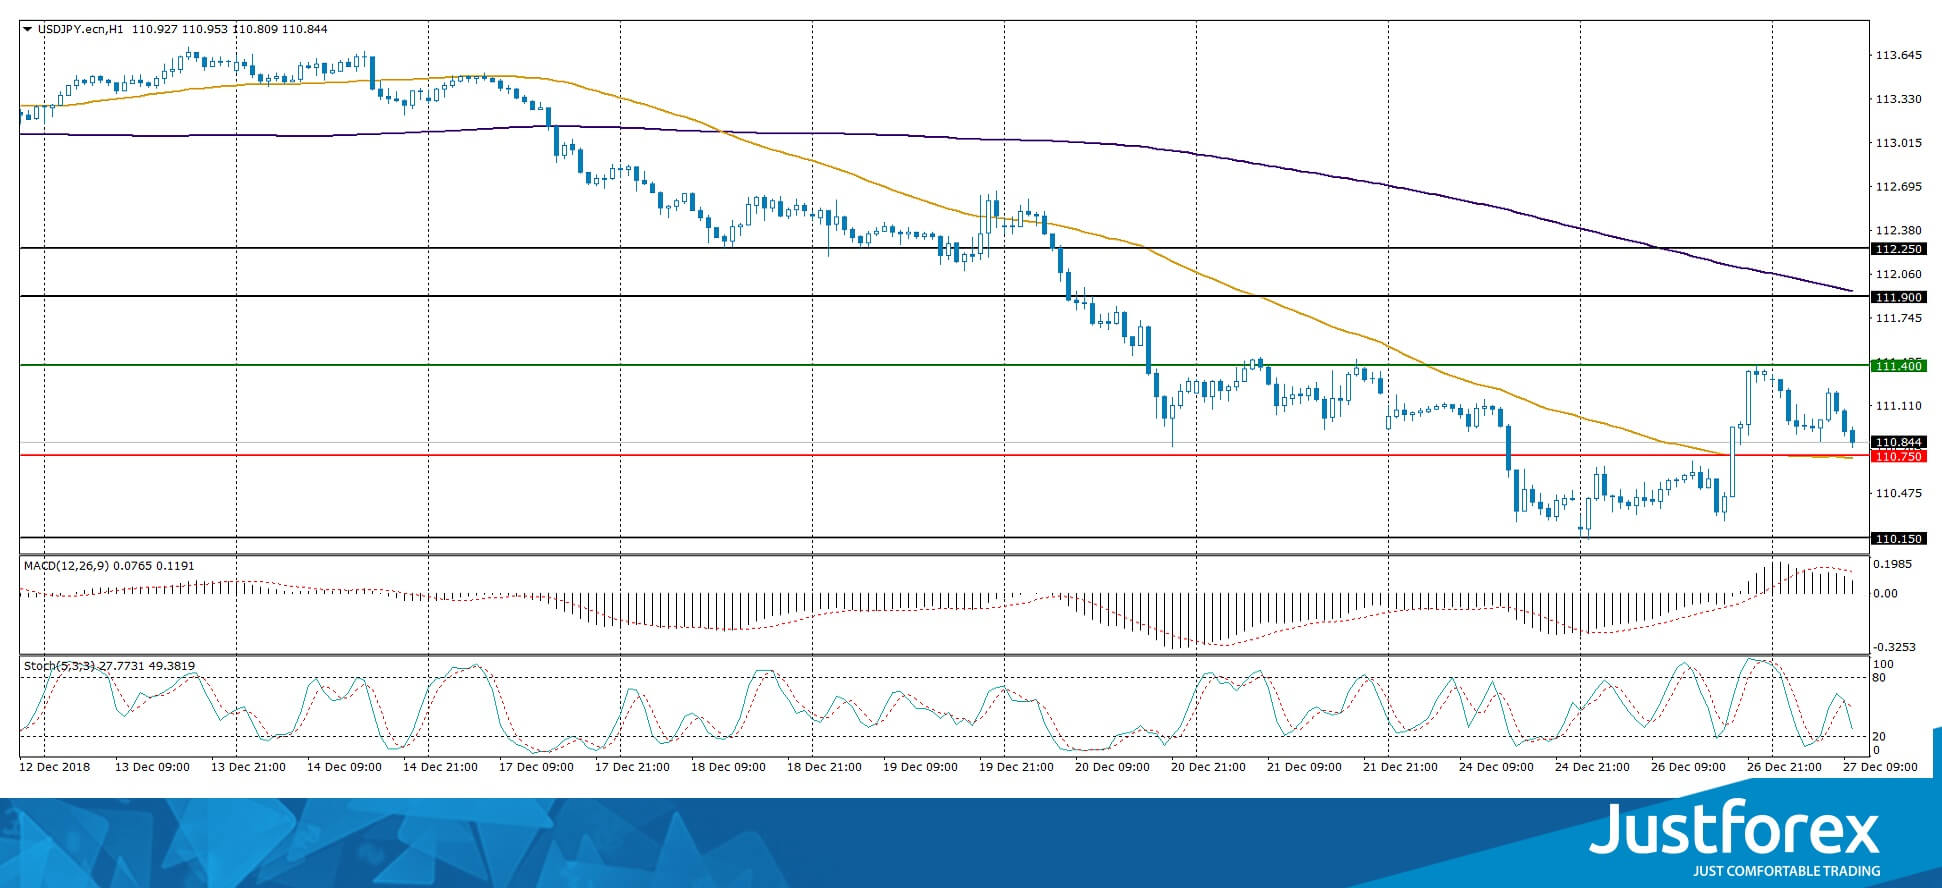
The indicators do not provide precise signals, the price has fixed between 50 MA and 200 MA.
The MACD histogram is in the positive zone but below the signal line, which gives a weak signal to buy USD/JPY.
The Stochastic Oscillator is in the neutral zone, the %K line is crossing the %D line. There are no signals at the moment.
Trading recommendations
Support levels: 110.750, 110.150
Resistance levels: 111.400, 111.900, 112.250
If the price fixes above the resistance level of 111.400, expect further growth of the USD/JPY quotes toward 111.900-112.250.
Alternatively the quotes can descend toward 110.250-110.100.


